TSTool / Getting Started
This chapter provides an overview of the TSTool graphical user interface (GUI).
- Introduction
- Starting TSTool
- Database Selection and User Authentication
- Main Interface
- File Menu - Main Input and Output Control
- Edit Menu - Editing Commands
- View Menu –-Display Useful Information and Map Interface
- Commands Menus
- Run Menu - Run Commands
- Results Menu - Display Time Series
- Tools Menu
- Help Menu
Introduction
The TSTool GUI has three main functions:
- Browse and view time series data. In this capacity, a graph or summary can be created and then TSTool can be closed.
- Automate time series processing. For example, format lists of time series for use with simulation models or other software. In this capacity, time series that are read and displayed can be incorporated into a command file, which can be run to generate time series files.
- Process time series products. For example, create graphs for use on web sites or to facilitate review data or modeling results. In this capacity TSTool is used to generate data products in a streamlined fashion. The remainder of this chapter provides an overview of the graphical user interface, in the general order of the main features and menus on the menu bar (left to right, top to bottom). The features necessary to accomplish the above tasks are described at an introductory level. See other chapters for more detailed information. See also the training materials that are available for TSTool.
Starting TSTool
When using the State of Colorado’s CDSS configuration for TSTool, the software can be started on Windows using Start / All Programs / CDSS / TSTool-Version (or Start / Programs / CDSS / TSTool-Version). The menus vary slightly depending on the operating system.
TSTool also has been implemented for Linux and Mac OS X,
in which the tstool script can be run to start the software.
To process a command file in batch mode without showing the user interface, use a command line similar to the following:
tstool –commands commands.TSTool
It is customary to name command files with a .TSTool file extension.
It may be necessary to specify a full (absolute) path to the command file when
running in batch mode in order for TSTool to fully understand the working directory.
See the Running TSTool in Various Modes appendix
for more information about running in batch and other modes.
Database Selection and User Authentication
Some data systems require authentication before a connection to the data can be established. A database selection also may be required. If database selection or authentication is required, TSTool may display a dialog at startup asking for information. This convention is being phased out in favor of database datastores that are configured prior to runtime.
For example, if the HydroBase input type is enabled (see the HydroBase Input Type Appendix), the HydroBase login dialog will be shown when TSTool starts in interactive mode. The dialog is used to select a server and database for the State of Colorado’s HydroBase database. A HydroBase database can also be selected from the File / Open / HydroBase... menu. The following example illustrates using HydroBase on a local computer.
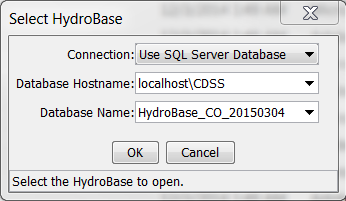
Select HydroBase Database Dialog
HydroBase features will be disabled if the HydroBase login is canceled.
Database connections are often configured using configuration files so that the dialog confirmation can be avoided. See the Installation and Configuration appendix and information in the data store appendices. The Tools / Options menu allows input types to be enabled and disabled.
Main Interface
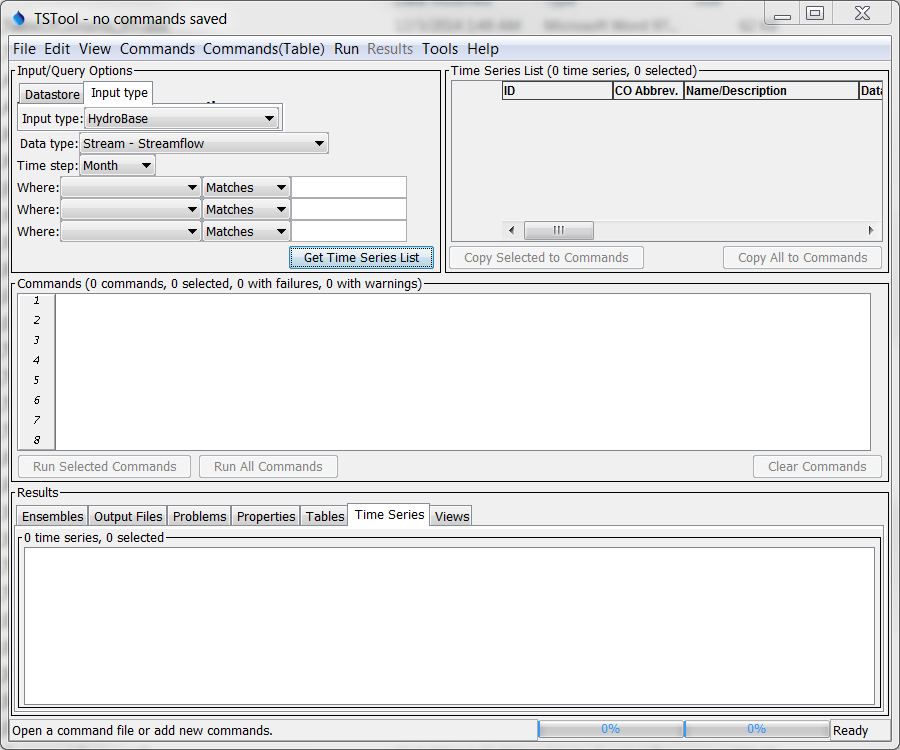
The following figure illustrates the main TSTool interface immediately after startup. A message is displayed in the upper left letting the user know that data connections are still being initialized for configured datastores. Trying to use commands that depend on data connections that have not been initialized will result in errors.

TSTool At Startup, Waiting for Data Connections to be Initialized (see also the full-size image)
The following figure illustrates the main TSTool interface after data connections are initialized. The interface is divided into three main areas:
- Input/Query Options (top left) and Time Series List area (top right)
- Commands (middle)
- Results (bottom)
Status and progress information is displayed at the bottom of the main window and also in the borders around main panels (e.g., to show how many items are in a list and how many are selected).
Initial TSTool Interface (see also the full-size image)
Input/Query Options and Time Series List Area
The upper part of the main window contains the Input/Query Options and Time Series List area. The Input/Query Options choices help select time series information from datastores (databases and web services) and input types (typically files and some databases). The interactive query interface is useful when selecting a time series from a file, database, or web service (internet). An alternative to the following interactive approach is to use read commands from the Commands menu (see the Commands chapter). To select time series, perform the following steps:
- Select the source of the data. Select a Datastore or Input type.
- A data store is a repository that generally contains multiple time series (e.g., a database, web service, or file). The details about the datastore are included in a simple configuration file (see datastore appendices).
- Input types define the storage format (e.g., database or file)
for time series data, and may require an input name.
Selecting some input types may prompt for a file,
which is then listed in the Input name choices immediately below Input type.
The datastore design is being phased in because it provides more flexibility in defining data connections. In the future, all database connections will be transferred to datastores and remaining input types may be referred to as “file datastores”, which will use a filename.
The DateValue input type is the default. More specific input types (e.g., HydroBase) may be the default if enabled. See the appropriate data store or input type appendix for more information.
Depending on the input type, some of the remaining selection choices described below may be disabled or limited.
- Select the time series data type. Select the Data type (if appropriate for the input type). For example, select Streamflow or Diversion if using a HydroBase input type. For some input types, the data type will be listed as Auto, indicating that the data type automatically will be determined from the data.
- Select the time series time step (interval). Select the Time step (if appropriate for the input type). The time step, also referred to as the data interval, generally will be limited by the input type. For example, if reading from the HydroBase database, the Streamflow data type will result in Day, Month, and Irregular (real-time) time steps being listed. The time step will be shown as Auto for input types where the time step is determined as data are read.
- Specify filter criteria for the time series list. Specify the Where and Is clause(s) for the query (if appropriate for the input type). This information will limit the number of time series that are returned. The filters are highly dependent on the original data.
- Generate the time series list. Press the Get Time Series List button in the Input/Query Options area, and TSTool will display a list of matching time series in the Time Series List. If the input type is a file, you may first be prompted to select the file containing the time series. The Time Series List shows a list of matching time series, typically including location and time series properties. As much as possible, the column headings are consistent between different input types. The results are typically sorted by name or identifier if from a database, or if read from a file are listed according to the order in the file. Right-click on the column headings and select Sort Ascending to sort by that column. The sorts are alphabetical so some numeric fields may not sort as expected due to spaces, etc.
- Copy time series identifiers to the command list. TSTool requires that time series identifiers (TSIDs) be created in the Commands list area in order to read the time series data values. To create TSIDs from the Time Series List, selecting one or more rows in the Time Series List (note that the first column will not allow selections) and then press the Copy Selected to Commands button. Or, if appropriate, press the Copy All to Commands button.
- Read and display time series. The Commands and Results areas are discussed below. To process time series having different data types or time steps, make multiple queries using the Input/Query Options and Time Series List areas and select from the lists as necessary, accumulating time series identifiers in the Commands list.
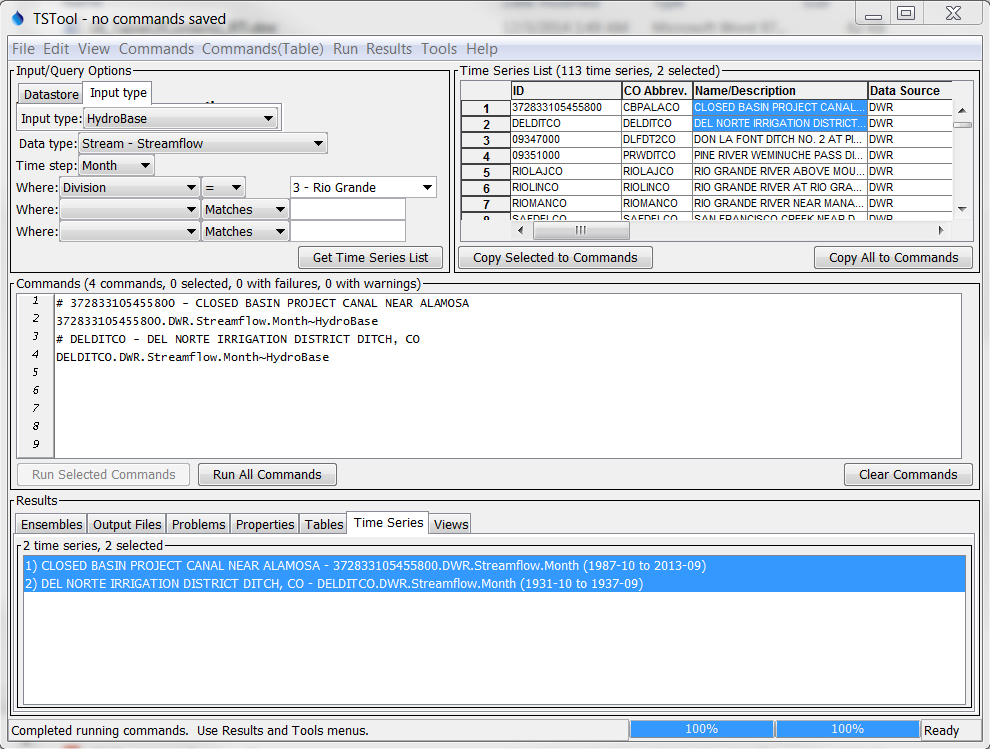
After selecting time series and copying to the Commands area, the main interface will appear similar to the following figure. As TSIDs are inserted, TSTool will attempt to read the time series properties to ensure that the TSID is correct, and an indicator will be shown for time series that could not be retrieved. This may result in a slight pause but helps ensure that commands are functional.
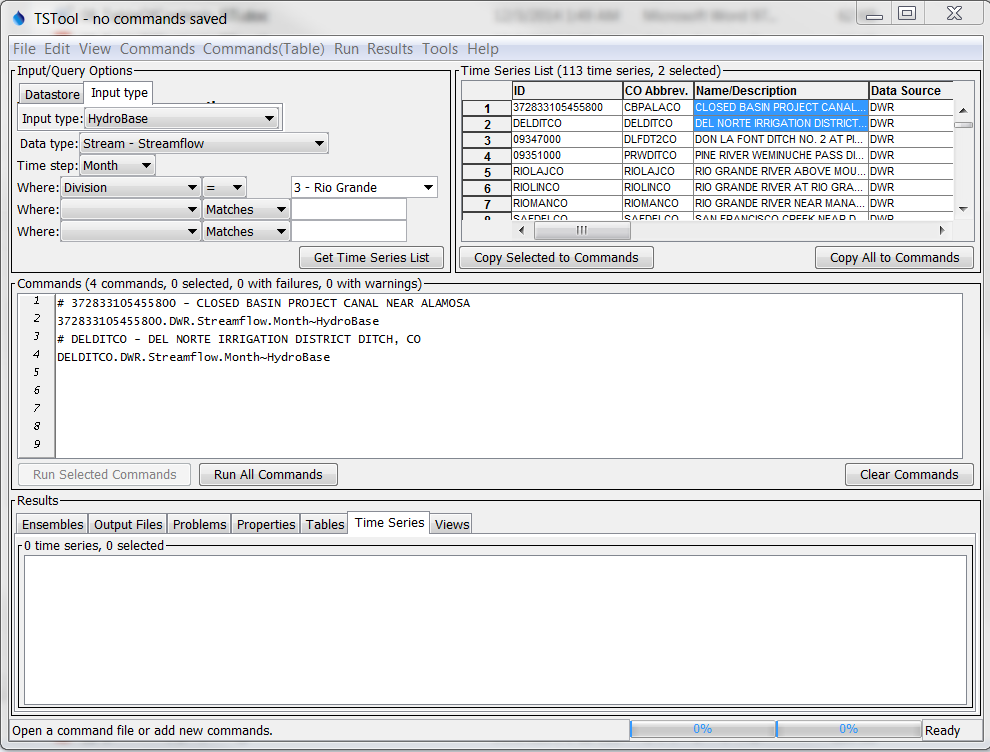
TSTool after Pressing Get Time Series List and selecting from Time Series List (see also the full-size image)
Command List and Command Error Indicators
The Commands list occupies the middle of the main interface and contains:
- time series identifiers corresponding to time series selected from the Time Series List
- commands inserted using the Commands menu (see the Commands chapter).
Time series identifiers are added to the Commands list by selecting items in the
Time Series List and copying the identifiers to the Commands list, as discussed above.
An alternative to using the Time Series List to select time series is to use
specific read commands from the Commands menu (e.g., use a
ReadDateValue command).
Using read commands is useful when more control is needed during the
data read or when processing more than one time series with one command.
The Commands and other TSTool GUI lists behave according to standard conventions for the operating system. For example, on Windows:
- Single-click to select one item.
- Ctrl-click to additionally select an item.
- Shift-click to select everything between the previous selection and the current selection.
Behavior on operating systems other than Windows may vary. Right-clicking over the Commands list displays a pop-up menu with useful command manipulation choices, some of which are further described in following sections. A summary of the pop-up menu choices is as follows:
| Menu Choice | Description |
|---|---|
| Show Command Status Success/Warning/Failure | Displays the status of a command for each phase of command processing (more discussion below after table). |
| Edit | Edit the selected command using custom edit dialogs, which provide error checks and format commands. Double-clicking on a command also results in editing the command. |
| Cut | Cut the selected commands for pasting. |
| Copy | Copy the selected commands for pasting. |
| Paste (After Selected) | Paste commands that have been cut/copied, pasted after the selected row. |
| Delete Command(s) | Delete the selected commands (currently same as Cut). |
| Find Commands(s) | Find commands in the command list. This displays a dialog. Use the right-click in the found items to go to or select found items. |
| Select All Commands | Select all the commands. |
| Deselect All Commands | Deselect all the commands. This is useful because only selected commands are processed (or all if none are selected). It is therefore important not to unknowingly have one or a few commands selected during processing. |
| Convert Selected Commands to # Comments | Convert selected commands to # comments. |
| Convert Selected Commands from # Comments | Convert # comments to commands. |
| Convert TSID command to general ReadTimeSeries() command | Convert the selected TSID command to a ReadTimeSeries command. This general command allows an alias to be assigned to the time series. |
| Convert TSID command to specific Read...() command | Convert the selected TSID command to a specific Read... command. The TSID is examined to determine a suitable read command. Specific read commands may provide parameters to control reading the time series, and may also allow multiple time series to be read. |
| Run All Commands (create all output) | Run all commands and create output (e.g., graphs and files). |
| Run All Commands (ignore output commands) | Run all commands but skip any output commands. This is useful if a batch command file has been read and time series are to be listed in the GUI but output products are not to be generated automatically. |
| Run Selected Commands (create all output) | Run selected commands and create output (e.g., graphs and files). |
| Run Selected Commands (ignore output commands) | Run selected commands but skip any output commands. This is useful if a batch command file has been read and time series are to be listed in the GUI but output products are not to be generated automatically. |
Commands are numbered to simplify editing. The command list also includes left and right gutters to display graphics that help with error handling. The following figure illustrates a command with an error (the first time series identifier has been edited to include an x, resulting in an invalid identifier).
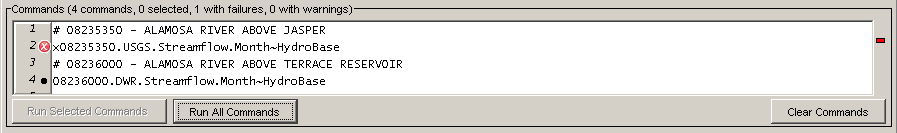
Command List Illustrating Error
The following error handling features are available:
- The graphic in the left gutter indicates the severity of a problem (see below for full explanation).
- The colored indicator on the right indicates the severity of a problem by its color and, when clicked on, positions the visible list of commands to display the command corresponding to the problem.
- Commands have three phases: 1) initialization, 2) discovery, 3) run. Initialization occurs when reading a command file or adding a new command. The discovery phase is executed only for commands that generate time series for other commands and provides other commands with identifiers used in command editing. The run phase generates full output.
- Positioning the mouse over a graphic in the left or right gutter will show a popup message with the problem information. The popup is only visible for a few seconds so use the right-click popup menu Show Command Status (Success/Warning/Failure) for a dialog that does not automatically disappear.
- Clicking on the left gutter will hide and un-hide the gutter.
The meaning of the error handling symbols is described in the following table. The symbol for the most severe error will be displayed next to each command.
Command List Graphics for Problems
| Problem Graphic | Description |
|---|---|
| No graphic | Command is successful (a warning or failure has not been detected). |
 |
The status is unknown, typically because the command has just been inserted. |
 |
The command has a problem that has been classified as non-fatal. For example, an input file has not been found. In general, commands with warnings need to be fixed unless work is preliminary. |
 |
The command has failed, meaning that output is likely incomplete. A problem summary and recommendation to fix the problem are available in the status information. Commands with failures generally need to be fixed. Software support should be contacted if the fix is not evident. |
It is possible that a problem indicator will be shown during command editing and will be cleared when commands are run. For example, a command may depend on a file that is created by a previous command. It is important that errors displayed after running commands are resolved.
Time Series Results
The commands in the Commands list are processed by pressing the Run Selected Commands or Run All Commands buttons below the Commands list area (or by using the Run menu). The time series and other output that result from processing are listed in the bottom of the main interface, as shown in the following figure:
TSTool after Running Commands (see also the full-size image)
The time series listed in the Time Series Results list can then viewed using the Results menu, analyzed further using the Tools menu, and output using the File / Save menus. Only the selected time series will be output (or all if none are selected).
The following results may be available, depending on commands that were run:
- Ensembles – groups of time series with an ensemble identifier. Individual time series that are associated with an ensemble also are shown in the Time Series tab. Right-click on item to access viewing and analysis options.
- Output Files – files that are created during processing. Single-click on a file to view.
- Problems – a full listing of warning and failure messages from all commands.
- Tables – column-oriented tables created during processing. Right-click on a table in the list to view the table.
- Time Series – time series created during processing. Right-click on one or more time series to view the time series.
- Views – alternate views of time series, other than the list of time series that is ordered based on command output.
Two progress bars at the bottom of the main window are updated during processing. The left progress bar indicates the overall progress in processing the commands (100% means that all commands have been processed). The right progress bar is used with commands that provide incremental progress during processing, a feature that will be phased in over time for commands that take longer to run. For example, if a single command processes many time series, this progress bar can be used to indicate progress in the command.
Right-clicking over the Time Series Results list displays a pop-up menu with useful time series viewing choices, including a choice to view the time series properties. The right-click menu choices are summarized below:
Time Series Results List Popup Menu Choices
| Menu Choice | Description |
|---|---|
| Graph – Area | Display a graph where the area below time series is filled in. |
| Graph – Area (stacked) | Display a graph where the area below time series is filled in, with the time series values being cumulative. |
| Graph – Bar (left of date) | Display bar graph for selected time series, drawing bars to the left of the date. |
| Graph – Bar (center on date) | Display bar graph for selected time series, drawing bars centered on the date. |
| Graph – Bar (right of date) | Display bar graph for selected time series, drawing bars to the right of the date. |
| Graph – Duration | Display a duration graph for the selected time series. |
| Graph – Ensemble | Display the time series in ensemble form. Historical years are overlapped. |
| Graph – Line | Display a line graph for selected time series. |
| Graph – Line (log Y-axis) | Display a line graph for the selected time series, using a log10 y-axis. |
| Graph – Period of Record | Display a period of record graph for the selected time series. |
| Graph – Point | Display a graph using symbols but no connecting lines. |
| Graph – Predicted Value | Display a graph of data and the predicted values from regression. |
| Graph – Predicted Value Residual | Display a graph of data minus the predicted values from regression. |
| Graph – XY-Scatter | Display an XY-scatter plot for the selected time series. |
| Table | Display a scrollable table for the selected time series. |
| Report – Summary (HTML) | Display an HTML summary for selected time series using the default web browser. |
| Report – Summary (Text) | Display a text summary for selected time series. |
| Find Time Series... | Find time series in the time series list. This displays a dialog. Use the right-click in the found items to go to or select found items. |
| Select All for Output | Select all time series for output. |
| Deselect All | Deselect all time series for output. |
| Time Series Properties | Display the time series properties dialog (see the TSView Time Series Viewing Tools appendix for a complete description of the properties interface). |
TSTool does not usually try to decide what titles or other graph properties to use for graphs because of the variability in input data that are handled by TSTool. However, as of version 12.00.00, graph templates have been enabled to allow configuration of standard graphs. The Ensembles and Time Series results tabs provide Graph with template: buttons. These buttons can be used to graph an ensemble or time series by relaying on a template graph time series product. The TSView Time Series Viewing Tools appendix Time Series Graph Templates section provides information about time series products.
The TSTool interface also provides an intermediary step to using graph templates specifically for ensembles. If Graph – Ensemble is selected for a time series, the following dialog will be shown.
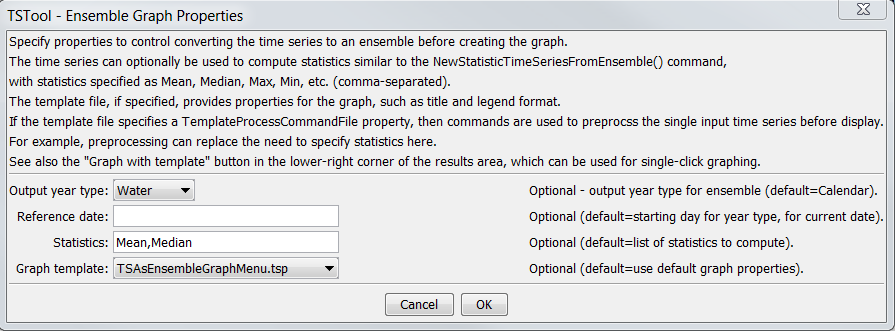
Results – Graph Ensemble Dialog (see also the full-size image)
This dialog provides the ability to indicate how the selected
time series should be processed into an ensemble,
and also allows a graph template to be selected,
which typically provides information about graph properties such as title and legend.
The Output year type and Reference date input are passed
to the same code as the CreateEnsembleFromOneTimeSeries command.
The Statistics input allows statistics time series to be calculated and added to the graph,
and are passed to the same code as the
NewStatisticTimeSeriesFromEnsemble command.
Finally, the Graph template selection specifies a graph template
and is used similar to the ProcessTSProduct command.
These steps are necessary for TSTool to be able to generically handle various input and configurations.
The resulting graph will be shown and will reflect the calculations and configuration properties.
All input is optional and if omitted will result in default output.
A similar dialog is used if Graph – Line (Ensemble Graph) is selected for ensemble results, as shown below. In this case there is no need to create a new ensemble since it already exists. Therefore, input is provided to add statistics time series to the output, and specify the graph template to configure the graph.
Results – Graph Ensemble Dialog (see also the full-size image)
The remainder of this chapter summarizes the TSTool menus.
File Menu - Main Input and Output Control
The File menu provides standard input and output features as described below. Some menus are visible only when certain input types are enabled or when time series have been processed.
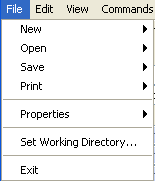
File Menu
File / New - Open Command File or Databases
The File / New / Command File menu item clears the current commands so that a new command file can be started. A new command file name will be requested when the commands are saved.
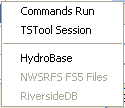
File / Open – Open Command File or Databases
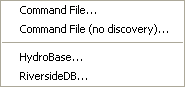
File / Open Menu
The File / Open / Command File menu item displays a dialog to select an existing command file. The menu may also show a list of previously opened command files and options specific to a database. For example, some databases allow interactive logins. After a file is selected, the file contents replace the contents of the Commands list. A prompt is displayed if commands already exist in the Commands list and have been modified. Opening a command file causes the working directory (folder) to be set to the folder from which the command file was read. All other files specified with a relative path will be found relative to the command file. The File / Open / Command File (no discovery) menu item can be selected to load a command file without running discovery mode, which may be appropriate when loading large command files such as generated by expanding a template. Discovery mode is needed when editing commands because it provides lists of time series and other data to command editors.
TSTool automatically will attempt to update older command files to new syntax if a command has changed. If a change occurs, the command file will be marked as modified and will need to be saved to reflect the changes. If an error occurs updating a command, it will be marked with an error and a comment will be inserted with the original command indicating that an automated update could not occur. Unrecognized commands are marked with an error and will generate errors if run.
If appropriate for the TSTool configuration, other menu items will be displayed to allow opening databases. It is recommended that database connections be configured to automatically open; however, the menus are useful for development and troubleshooting.
File / Save – Save Command File, and Time Series
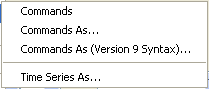
File / Save Menu
The File / Save / Commands and File / Save / Commands As menu items save the contents of the Commands list to a file. The name of the current command file is shown in the TSTool title bar and can be referred to when deciding a new command file name. All commands are saved, even if only a subset is selected. Saving a command file causes the working directory to be set to the folder where the command file was written. All other files specified with a relative path will be found relative to the command file.
The File / Save / Commands As (Version 9 Syntax)... menu
items saves the commands to a version 9 format command file.
The primary difference between version 9 and later syntax is that the
TS Alias = Command(...) syntax was replaced with Command(Alias=...) syntax in TSTool version 10.
The File / Save / Time Series As menu item displays a file chooser dialog for saving time series in the Time Series Results list. See the Input Type Appendices for examples of supported file formats. Only the selected time series in the Time Series Results list are saved (or all, if none are selected). Not all formats are supported because in most cases the write commands are used to automate processing of time series and provider greater control.
Print Commands
The File / Print / Commands menu prints the contents of the Commands list. This is useful when editing and troubleshooting commands.
Properties for Commands Run, TSTool Session, and Input Types
File / Properties Menu
The File / Properties / Commands Run menu item displays information from the last time that the commands were run, including global properties that impact results.
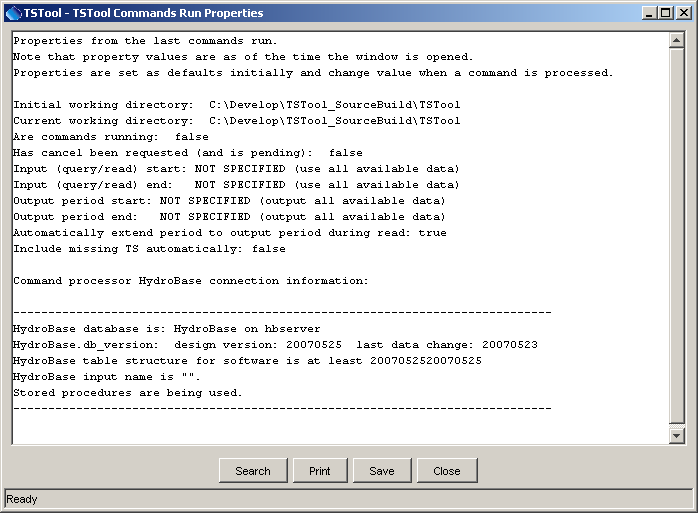
Properties of the Last Commands Run (see also the full-size image)
This information is useful for troubleshooting processing. The File / Properties / TSTool Session menu item displays information about the current TSTool session, as follows.
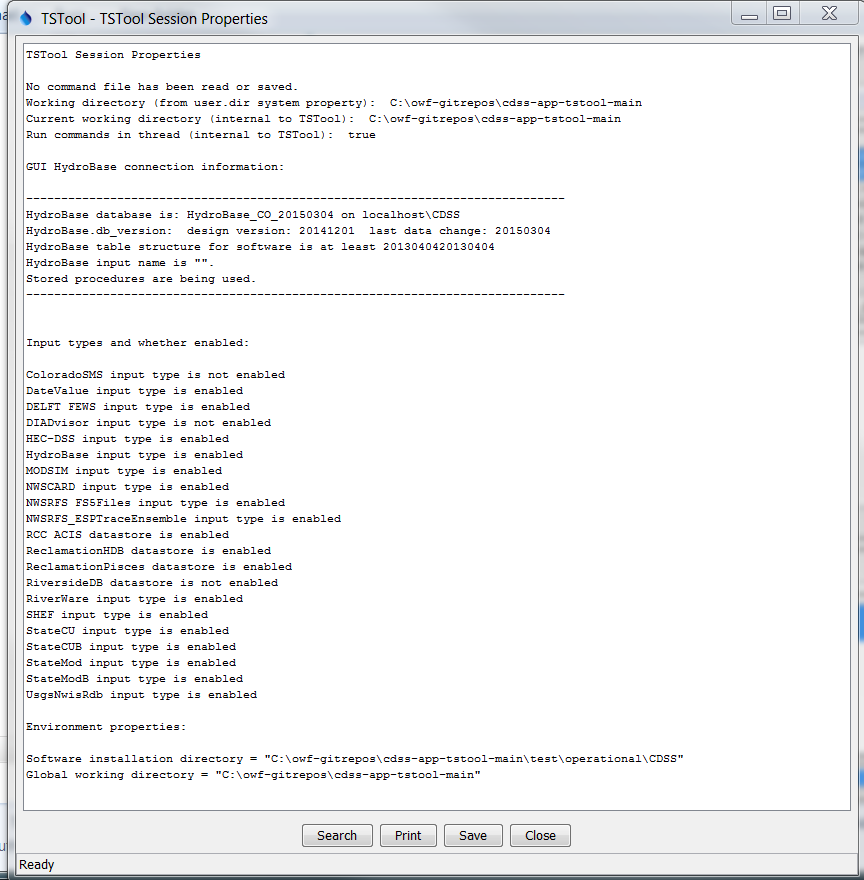
TSTool Session Properties (see also the full-size image)
This information is useful for checking the TSTool configuration. Additional properties displays may be available depending on enabled input types. For example, the File / Properties / HydroBase menu item displays HydroBase properties, including the database that is being used, database version, and the water districts that are in the database being queried. The water districts are determined from the structure table in HydroBase. The information that is shown is consistent with that shown by other State of Colorado tools and is useful for troubleshooting.
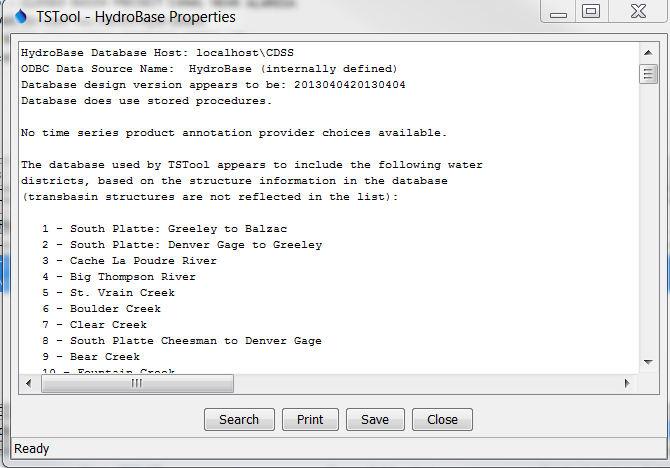
HydroBase Properties Dialog (see also the full-size image)
Set Working Directory
The File / Set Working Directory menu item displays a file chooser dialog that selects the working directory. The working directory is used by TSTool to local files specified with relative paths. The working directory normally is set in one of the following ways, with the current setting being defined by the most recent selection:
- The startup directory for the TSTool program,
- The directory where a command file was opened,
- The directory where a command file was saved,
- The directory specified by a
SetWorkingDircommand (use of this command is discouraged because it hard-codes a system-specific folder in command files), - The directory specified by File / Set Working Directory.
The menu item is provided to allow the working directory to be set before a command file has been saved (or opened).
File / Exit
The File / Exit menu exits TSTool. A confirmation prompt is displayed before exiting. If commands have been modified, they can be saved before exiting. Commands may have been automatically updated by TSTool if an old command file was read.
Edit Menu – Editing Commands
The Edit menu can be used to edit the Commands list. Edit options are enabled and disabled depending on the status of the Commands list. Specific edit features are described below. Right clicking over the Commands list provides a popup menu with choices similar to those described below.
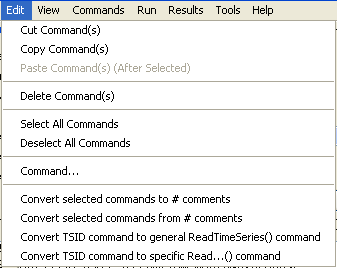
Edit Menu
Cut/Copy/Paste/Delete
The Edit / Cut Command(s) and Edit / Copy Command(s) menu items are enabled if there are items in the Commands list. Currently, these features do not allow interaction with other applications. Cut Command(s) deletes the selected item(s) from the Commands list and saves its information in memory. Copy Command(s) just saves the information in memory. After Cut Command(s) or Copy Command(s) are executed, select an item in the Commands list and use Paste Command(s) (After Selected) (see below).
Paste Command(s) (After Selected) is enabled if one or more commands from the Commands list has been cut or copied. To paste the command(s), select commands in the Commands list and press Edit / Paste Command(s) (After Selected). The commands will be added after the last selected command. To insert at the front of the list, paste after the first command, and then cut and paste the first command to reverse the order.
The Delete choice currently works exactly like the Cut Command(s) choice. Additionally, after lines in the Commands list have been selected, you can press the Clear Commands button below the Commands list to cut/delete.
The Clear Commands button in the Commands area deletes the selected commands or all commands if none are selected. A confirmation prompt is displayed if no commands are selected.
Select All Commands/Deselect All Commands
The Edit / Select All Commands and Edit / Deselect All Commands menu items are enabled if there are items in the Commands list. Use these menus to facilitate editing. Note that when editing commands it is often useful to deselect all commands so that new commands are added at the end of the commands list.
Edit Command
The Edit / Command menu can be used to edit an individual command. TSTool will determine the command that is being edited and will display the editor dialog for that command, performing data checks. Most old commands automatically will be detected and will be converted to new command syntax. This feature is also accessible by right clicking on the Commands list and selecting the Edit menu item and by double-clicking on a command.
Convert Selected Commands To/From Comments
The Edit / Convert selected commands to comments menu can be used to toggle selected
commands in the Commands list to comments (lines that begin with #).
This is useful when temporarily disabling commands, rather than deleting them.
The Edit / Convert selected commands from comments menu can be used to toggle selected commands in the Commands list from comments back to active commands. This is useful when re-enabling commands that were temporarily disabled.
Note that the multi-line /* */ comment notation can be inserted using the
Commands / General – Comments menu.
Convert TSID to Read Commands
The Edit / Convert TSID command to general ReadTimeSeries() command inserts a new
ReadTimeSeries command using
the TSID and replaces the original TSID command.
The ReadTimeSeries
command allows an alias to be specified for the time series.
The Edit / Convert TSID command to specific Read…() command inserts
a new read command using the TSID and replaces the original TSID command.
Specific read commands may not be available for all input types and
therefore the ReadTimeSeries command may need to be used.
Alternatively, insert a read command using the Commands menu choices.
View Menu - Display Useful Information and Map Interface
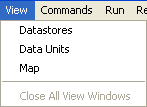
View Menu
The View / Datastores menu item displays a list of configured data stores, which is useful when troubleshooting whether a data store is properly configured. Note that some data stores are not listed in the main window Datastore choices but are available for use by commands.
The View / Data Units menu item displays a list of configured data units, which are recognized by the ConvertDataUnits command and other TSTool features that enforce data unit consistency. Data units from all data repositories are not automatically understood by TSTool, although additional capabilities may be added in the future.
The View / Map menu displays a map interface in a separate window. See the Spatial Data Integration chapter for more information.
The View / Close All View Windows menu closes all visible view windows, including graphs. This is useful if the command file has generated many graphs and the user wishes to close them all at once.
Commands Menus
The Commands menu provides several menus (as shown in the following figure), which insert commands into the Commands list.
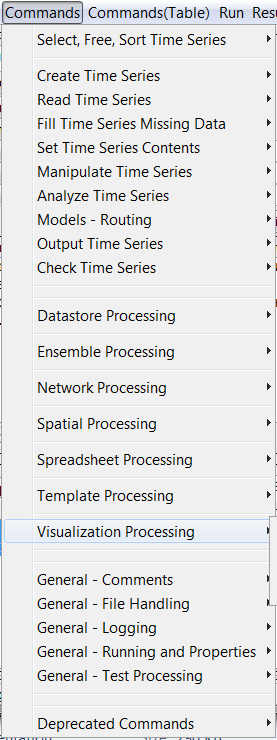
Commands Menu
Time series commands are organized into the following categories:
- Select, Free, Sort Time Series – select or deselect time series for processing, free or sort time series
- Create Time Series – create one or more new time series
- Read Time Series – read time series from a file or database
- Fill Time Series Missing Data – fill missing data
- Set Time Series Contents – set time series data or properties
- Manipulate Time Series – manipulate data (e.g., scale a time series’ data values)
- Analyze Time Series – perform analysis on time series (e.g., determine wet/dry/average pattern)
- Models – Routing – lag and attenuate time series
- Output Time Series – write time series results to a file or produce graphical products
- Check Time Series – check time series values and statistics against criteria
- Datastore Processing – read data from and write data to datastores, using general functionality
- Ensemble Processing – commands that are specific to ensemble processing
- Network Processing – commands that process networks of nodes and links
- Spatial Processing – commands that process spatial data
- Spreadsheet Processing – commands that process spreadsheet files
- Template Processing – commands that are specific to template processing
- Visualization Processing – commands that are specific to visualization
- General – Comments – insert comments
- General – File Handling – commands to manipulate files and perform FTP and web retrieval
- General – Logging – commands for logging (e.g., open a log file, set message levels)
- General – Running and Properties – commands to control processing and run external programs
- General – Test Processing – commands to process tests, to validate software and procedures
- Deprecated Commands – commands that are planned for removal
The Commands(Table) menu provides commands for table processing.
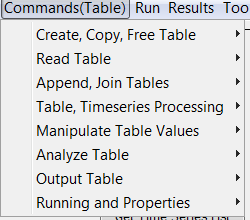
Commands(Table) Menu
Table commands are organized into the following categories:
- Create, Copy, Free Table – create, copy and free memory for tables
- Read Table – read tables from various input
- Append, Join Tables – append and join tables
- Table, Timeseries Processing – manipulate data between tables and time series
- Manipulate Table Values – manipulate table contents
- Analyze Table – analyze table contents, for example to compare tables
- Output Table – write tables to various output formats
- Running and Properties – manipulate processor properties in and out of tables
The Commands Chapter discusses commands in more detail and the Command Reference Appendix provides a reference for each command.
Run Menu – Run Commands
The Run menu processes the Commands list to generate results.
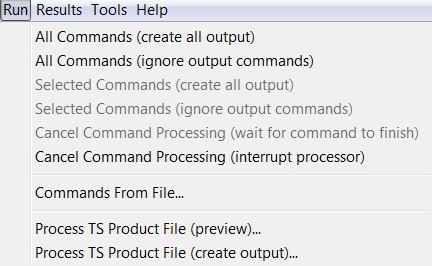
Run Menu
The Run / All Commands (create all output) menu will process all the commands in the Commands list and create output.
The Run / All Commands (ignore output commands) menu will process the commands in the Commands list, ignoring commands that generate output products. This increases performance and minimizes creation of files.
The Run / Selected Commands menu items are similar to the above, except that only selected commands are run.
The Run / Cancel Command Processing (wait for command to finish) menu items will be enabled if command processing is active, and allows the processing to be canceled. Processing may continue until the current command finishes.
The Run / Cancel Command Processing (interrupt processor) menu will interrupt processing of the current command. This should only be used in cases where a large or long command file run has been started unintentionally.
The Run / Commands From File... choice will run a command file but will not generate any time series for viewing in the GUI. This is equivalent to running in batch mode but initiating the run from the TSTool GUI.
Menu items similar to the above also are available in a popup menu by right clicking on a command in the Commands list.
Process TSProduct
The Run / Process TS Product File menu items can be used to
create time series products by processing time series product definition files.
The time series identifiers in the files will be run similar to TSID commands.
The TSView Time Series Viewing Tools Appendix describes the format of these files.
Time series product definition files can be saved from graph views using
Save As / Time Series Product.
The ProcessTSProduct
command provides equivalent functionality.
Results Menu – Display Time Series
The Results menu displays time series that are listed in the Results list at the bottom of the TSTool main window and can also be displayed by right-clicking on results in the Time Series Results area. The time series can be viewed multiple times, using the same time series results.
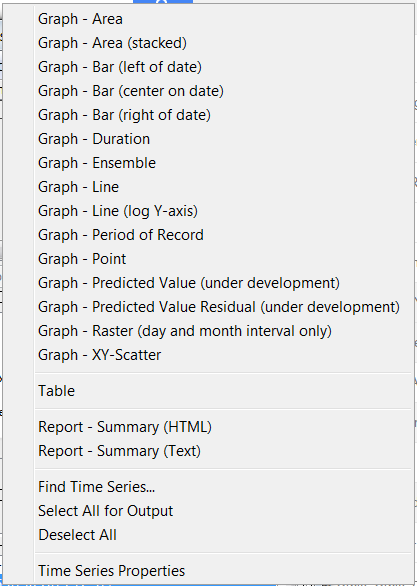
Results Menu
Graphing time series results in slightly different viewing options being available, depending on the type of graph. Three views of time series are generally available: graph, summary, and table. Graph properties can be edited by right-clicking on the graph. The TSView Time Series Viewing Tools Appendix describes the graphing tools in detail. The following table summarizes Results menu items.
Results Menu Choices
| Menu Choice | Description |
|---|---|
| Graph – Area | Display a graph where the area below time series is filled in. |
| Graph – Area (stacked) | Display a graph where the area below time series is filled in, with the time series values being cumulative. |
| Graph – Bar (left of date) | Display bar graph for selected time series, drawing bars to the left of the date. |
| Graph – Bar (center on date) | Display bar graph for selected time series, drawing bars centered on the date. |
| Graph – Bar (right of date) | Display bar graph for selected time series, drawing bars to the right of the date. |
| Graph – Duration | Display a duration graph for the selected time series. |
| Graph – Ensemble | Display an ensemble graph for the selected time series, which shifts the historical years to overlapping positions on the graph. |
| Graph – Line | Display a line graph for selected time series. |
| Graph – Line (log Y-axis) | Display a line graph for the selected time series, using a log10 y-axis. |
| Graph – Period of Record | Display a period of record graph for the selected time series. Each time series’ period is indicated by a horizontal line. An alternative to this graph type is to use the Tools…Data Coverage by Year report (see Chapter 5 – Tools). |
| Graph – Point | Display a graph using symbols but no connecting lines. This is useful for data that have infrequent measurements. |
| Graph – Predicted Value | Display a graph of data and the predicted values from regression. First, a regression analysis is performed, similar to the analysis done for the XY-Scatter plot. The original two time series are then plotted, additionally with the time series that would be generated using the regression results. The predicted time series and the original time series will be the same where their periods overlap, with only the predicted time series shown outside of that period. |
| Graph – Predicted Value Residual | Display a graph of data minus the predicted values from regression. The predicted value residual graph performs the same analysis as the predicted value graph. Where the original and predicted time series overlap, the difference is computed and plotted as a time series. The resulting bar graph therefore shows the relative goodness of fit of the estimated time series. |
| Graph – XY-Scatter | Display an XY-scatter plot for the selected time series. |
| Table | Display a scrollable table for the selected time series. |
| Report – Summary (HTML) | Display an HTML summary for selected time series using the default web browser. |
| Report – Summary (Text) | Display a text summary for selected time series. |
| Find Time Series... | Find time series in the time series list. This displays a dialog. Use the right-click in the found items to go to or select found items. |
| Select All for Output | Select all time series for output. |
| Deselect All | Deselect all time series for output. |
| Find Time Series... | Displays a dialog that can be used to find and select time series in the results. |
| Select All for Output | Select all the time series for output. |
| Deselect All | Deselect all the time series. |
| Time Series Properties | Display the time series properties dialog (see the TSView Time Series Viewing Tools appendix for a complete description of the properties interface). |
Tools Menu
The Tools menu lists tools that perform additional analysis on time series that are selected in the Time Series Results list. These features are similar to the Results features in that a level of additional analysis is performed to produce the data product.
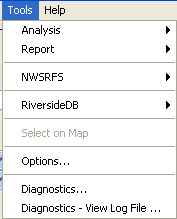
Tools Menu
Analysis tools are described in more detail in the Tools Chapter. The following sections describe the Tools / Options and Tools / Diagnostics features. Some tools are provided based on enabled input types.
Options
The Tools / Options menu displays program options. The Developer tab configures information that should only be modified by software developers.
The Datastores and Input Types (Installation) tab displays the datastores and input types that are enabled in the TSTool installation configuration file and allows the values to be changed. A warning will be shown if there are insufficient permissions to read or write the configuration file. These settings can only be changed by someone that has permission to edit files in the software installation folder. TSTool by default installs with standard configuration. However, features can be enabled or disabled to meet the needs of the user. This can improve performance because fewer software components are active. TSTool must be restarted to reflect changes to the list of enabled input types. Enabling an input type may result in additional commands and tools being shown; however, additional configuration may be required to fully enable access to data. Refer to the input type and data shore appendices for more information.
As of TSTool 11.09.00 the Datastores and Input Types (User) tab is also provided and allows enabling/disabling datastores and input types. The user settings will override the software installation settings. Datastores and input types will not be listed in the user configuration file by default and must be added to the file with a text editor. Once added, the Tools / Options editor will allow the settings to be toggled and rewritten to the configuration files.
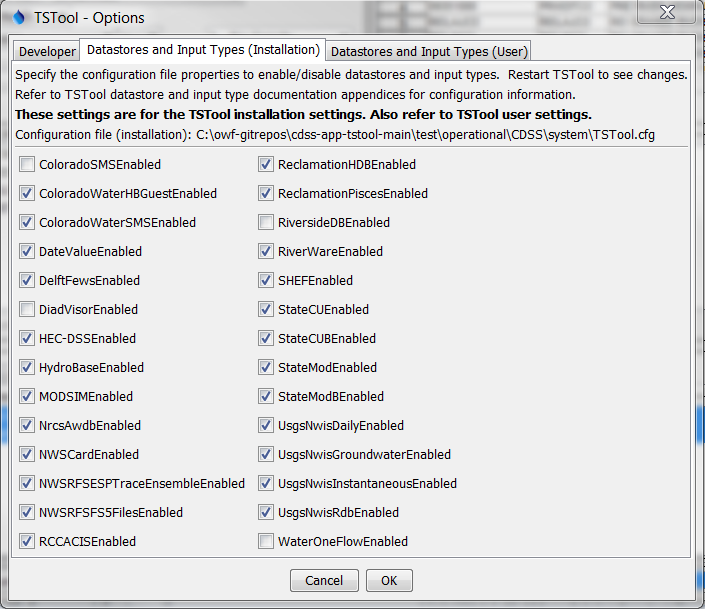
Datastore and Input Types that are Enabled based on Installation Configuration File (see also the full-size image)
Diagnostics
The Tools / Diagnostics menu displays the diagnostics interface, which is used to set message levels and view messages as TSTool processes data. The Tools / Diagnostics – View Log File menu displays the log file viewer. These tools are useful for troubleshooting problems. Refer to the Tools Chapter for more information.
Help Menu
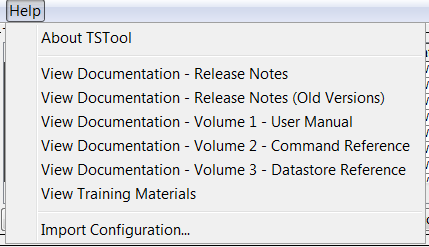
Help Menu
The Help / About TSTool menu item displays the program version number, for use in troubleshooting and support. Information about the software and system can be displayed from the version dialog, to help with troubleshooting.
The Help / View Documentation menu items display the PDF documentation using the default PDF viewer.
The Help / View Training Materials menu item opens a file system browser to the location of the training materials. Training materials are organized by topic and provide working examples.
The Help / Import Configuration menu item is used to import an old TSTool configuration file into a new software installation. It may be necessary to manually copy configuration old files, in particular for data store configuration. TSTool configuration files are saved in the system folder under the TSTool installation. This feature is needed less as of TSTool version 11.09.00 because user configuration files are used across TSTool versions.