2.4 - HydroBase Wizard
The HydroBase Wizard is an interactive tool that guides the user step-by-step through the development of a new monthly scenario and pulls required input data directly from HydroBase through an internet connection. The HydroBase Wizard can be used to create a new monthly Climate Station Scenario or a Structure Scenario. Required data (e.g. climate data, diversion records, crop characteristics) is pulled directly from HydroBase via an active internet connection and formatted into the correct input files.
Note that the purpose of the Wizard is to create a complete and operational scenario based on HydroBase data; it is the user’s responsibility to review and edit specific data in the input files through the GUI to obtain accurate results.
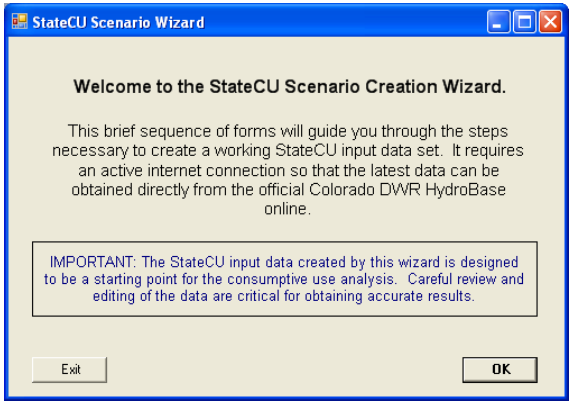
Activate the Wizard by selecting the Create new StateCU scenario using HydroBase Wizard command through the File menu. Figure 5 displays the introductory screen to the Wizard. All screens in the Wizard have an Exit button. Select the OK button to proceed to Step 1.
Figure 5 - StateCU Scenario Wizard Welcome (see also the full-size image)
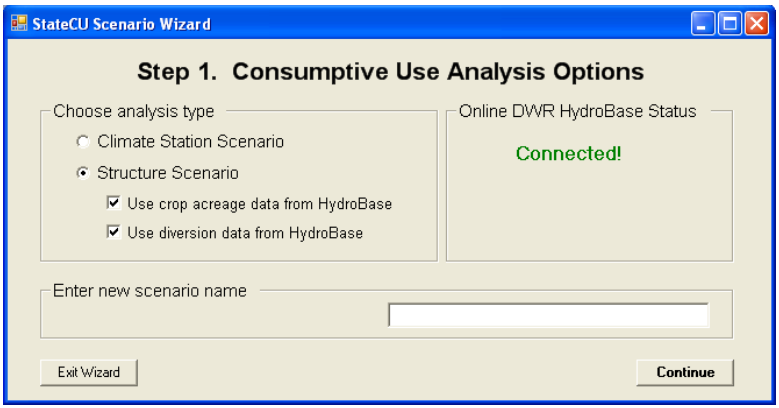
Step 1 of the Wizard (Figure 6) determines if the user would like to create a Climate Station Scenario or a Structure Scenario. Using the radio controls, select either the Climate Station Scenario or the Structure Scenario. If the Structure Scenario is selected, there is the option to use crop and acreage data from the data source and to use diversion data from the data source. If these options are checked, the crop, acreage and diversion data loaded in HydroBase for the specific structure the user will be modeling will be used when creating the input files. If either of these options is unchecked, the Wizard will ask for crop and acreage data to be manually entered in Step 3 and diversion data to be manually entered by the user in the GUI. If both options are unchecked, the user has the ability to create a new scenario based on a structure not found in HydroBase. See Section 2.4.2 for more information on these options.
Currently, the Wizard can only use the online DWR HydroBase via an internet connection as a source for the data. Future development may allow the Wizard to pull data from an existing scenario or from a locally loaded HydroBase. The message of ‘Connected’ in green text will appear if there is an active internet connection. If one is not available, the message will state ‘Not Connected!’ in red text and traditional file creation through the State Data Management Interfaces (DMI’s) utilizing a locally loaded HydroBase is necessary.
Enter a new scenario name, avoiding special characters, spaces or periods in the file name. All input files will receive the same scenario ‘base’ name. The Wizard saves all new scenarios to the C:\CDSS\Data\StateCUWizard directory. Click on the Continue button to move to the next step.
Figure 6 - Step 1 of Wizard - Analysis Options (see also the full-size image)
The following steps in the Wizard are dependent on which type of scenario is being developed. See Section 2.4.1 for the subsequent steps to build a Climate Station Scenario through the Wizard, and Section 2.4.2 for the steps to build a Structure Scenario.
2.4.1 - Climate Station Scenario Creation through Wizard
A Climate Station Scenario created in the Wizard will determine the potential crop consumptive use and irrigation water requirement for one or more crops at a specific climate station. Step 2 of the Wizard (Figure 7) determines which crop(s) will be used in the analysis. Crops, and their respective characteristics, that are currently loaded in HydroBase are the only crops available for inclusion in the scenario through the Wizard. Note that although acreage and crops can vary over time, the Wizard uses the single ‘snapshot’ of crop and percentages input in this step and applies them to all years in the scenario. This data can be edited in the GUI to represent changes in cropping practices.
Climate station scenarios are based on a unit-acre parcel basis at a single location, therefore the percentage of each crop on a single parcel is input in this step. Narrow the crop list by using the radio controls, indicating a subset by crop type (e.g. alfalfa, grass pasture, corn), or a subset by crop coefficient type (e.g. SCS TR21, Rio Grande calibrated coefficient). Refresh the available list of crops based on the subset criteria by clicking on the green arrow in the center of the window. The resulting crop name list can be sorted by clicking on the header label. Note the subset criteria and the resulting crop name list must include all of the crops for inclusion into the scenario. For example, if the user wants to determine the consumptive use for both Alfalfa.TR21 and Grass_Pasture.DWHA, the subset criteria would be set to ‘None’ so that both crop names would appear in the crop name list. Selected crops and percentages are lost if the crop name list is refreshed.
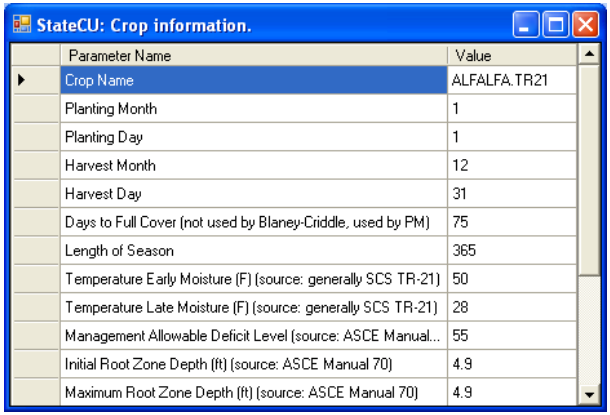
Use the check boxes to select crops to be entered in the scenario, and enter the associated percentages. The sum of all crop percentages must equal 100 percent. To view crop characteristics for any of the listed crops, check the box next to the crop name and then click on the View info about selected crop button. This will activate a window listing the crop information. Figure 8 displays the crop characteristics for the crop Alfalfa – SCS TR21. The user can not edit the crop information in this window; once the scenario has been created, the user can edit this information through the GUI. The user can also choose to apply an elevation adjustment to all TR21 Crop Coefficients, using the check box in the lower left corner of the window. The adjustment is applied to all TR21 crops selected by the user for inclusion in the scenario. Elevation adjustment preferences can also be edited through the GUI. Click on the Continue button after entering all the crop data to move to the next step.
Figure 7 - Step 2 of Wizard - Crop Selection (see also the full-size image)
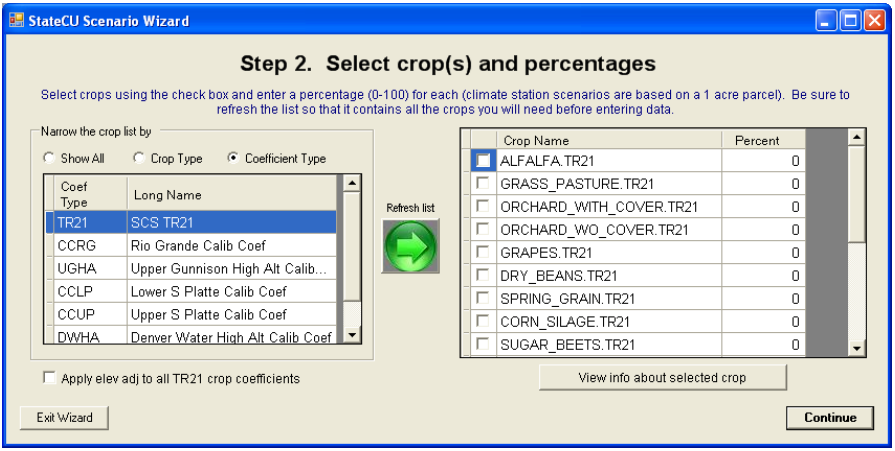
Figure 8 - Crop Information (see also the full-size image)
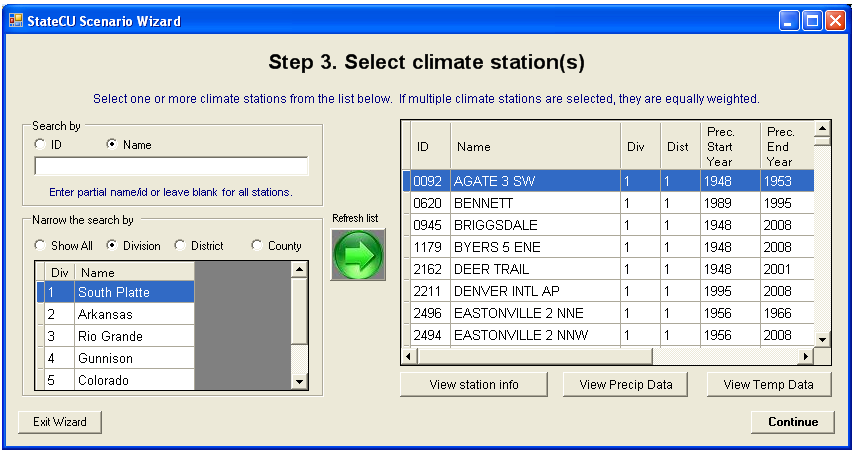
Step 3 of the Wizard (Figure 9) determines which climate station(s) will be used in the analysis. The Climate Station Scenario will only include one consumptive use location, however data from multiple climate stations can be used to determine the consumptive use. If multiple climate stations are selected, the Wizard equally weights the climate data from the multiple climate stations and uses the station ID of the first climate station listed as the identifier appended by ‘_field’ for the consumptive use location. For example, if Denver (ID 2220) and Greeley (ID 3546) climate stations are both selected, the Wizard would use '2220_field', representing the station ID from Denver as the consumptive use location identifier appended by ‘_field’, in the structure file and then include both stations in the climate station, temperature, precipitation and frost date files.
Climate stations, and their climate data, that are currently loaded in HydroBase are the only stations available for inclusion in the scenario through the Wizard. The user can either search by the name of the climate station or by the ID. To search by name, enter the name or partial name of a climate station and the subset criteria. Narrow the name search by County, by Division or by Water District, or search all available climate stations by indicating ‘Show All’. Click on the green arrow in the center of the window to refresh the list. To search by climate station ID, enter the full 4 digit or partial ID and click on the green arrow. No subset criteria are allowed when searching by ID. The resulting climate station list can be sorted by clicking on the header label.
Note the subset criteria and the resulting climate station list must include all of the climate stations to be included in the scenario. For example, if the user wants to determine the consumptive use using both Greeley and Denver data, the subset criteria could be set to ‘Division’ with the ‘Name’ box left blank so that both station names would appear in the climate station list. Selected stations are lost if the climate station list is refreshed.
Select and highlight one or more climate stations for inclusion in the scenario. Click on the View station info button to view climate station location information. It is recommended that the user review the start and end years, as well as the measured count of data for each climate data type to determine the extent of available data. Click on the View Precip Data and View Temp Data buttons to preview the available climate data. The user can not edit the climate data in these windows; once the scenario has been created, the user can edit the climate data through the GUI. Note that some climate stations may have only precipitation data or only temperature data (not both); therefore using a precipitation-only or temperature- only climate station in a scenario would not produce analysis results. Click on the Continue button after selecting all climate stations to move to the next step.
Figure 9 - Step 3 of the Wizard - Climate Station Selection (see also the full-size image)
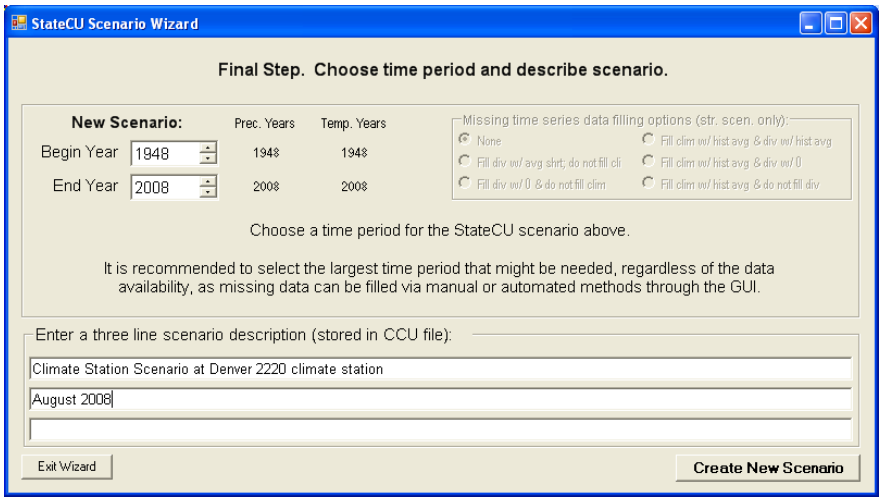
After completing the climate station selection in Step 3 of the Wizard, the user has determined all of the input parameters necessary to create a Climate Station Scenario. The Final Step of the Wizard (Figure 10) is to set the beginning and ending year of the analysis and enter a description of the scenario. The extent of available climate data from the climate station identifier is shown in the window to help guide the user in setting an applicable time period. Note that all time series data files will be created using these time period parameters. Through the GUI, an analysis can be adjusted to a smaller time period, but not a larger period, therefore it is recommended to define this period as large as available data can support. Missing data in the input files is indicated by -999 and consumptive use calculations can not be performed for years with any missing data. Note that options to fill missing data in this window are available only when creating Structure Scenario. Edit the years by typing over the default or using the up and down arrows.
Enter a description of the scenario in the three allotted lines, maximum of 120 characters per line. This information is stored in the header of the model control options file (*.ccu). Select the Create New Scenario to complete the creation of the scenario. The newly created Climate Station Scenario will automatically be loaded into StateCU, whereby the user can review and edit data, and run the consumptive use analysis.
Figure 10 - Final Step of the Wizard - Create New Scenario (see also the full-size image)
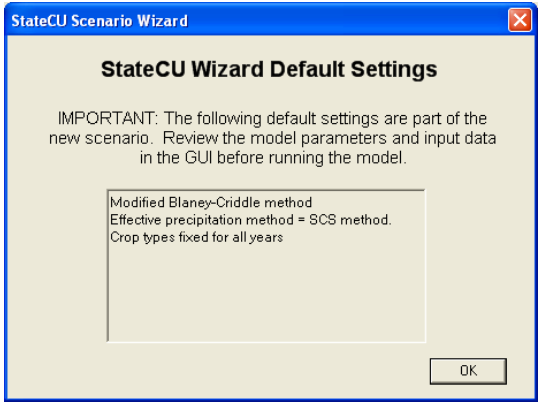
Several parameters and modeling options are not specifically input by the user into the Wizard, rather it is the responsibility of the user to review and edit these parameters through the GUI. The Wizard sets these parameters to defaults when creating the scenario. The default settings are listed in a window (Figure 11) that is activated once the scenario is created. The following is a list of these defaults settings:
- The Modified Blaney-Criddle consumptive use analysis method is set
- The effective precipitation method is set to the SCS method.
- Crop types and crop acreages is fixed for all years
Figure 11 - Climate Station Scenario Default Wizard Settings (see also the full-size image)
2.4.2 - Structure Scenario Creation through Wizard
A Structure Scenario created in the Wizard will determine the potential crop consumptive use, irrigation water requirement and water supply limited consumptive use for one or more crops at a specific diversion structure. Step 2 of the Wizard (Figure 12) determines the consumptive use location that will be used in the analysis. Diversion structures, and their respective diversion records, that are currently loaded in HydroBase are available for inclusion in the scenario through the Wizard. The user can either search by the name of the structure or by the ID. To search by name, enter the name or partial name of a diversion structure and the subset criteria. Narrow the name search by County, by Division, or by Water District or ‘Show All’ available structures. Click on the green arrow in the center of the window to refresh the list. To search by structure ID, enter the full 7-digit or partial ID and click on the green arrow. No subset criteria are allowed when searching by ID. Note that there are numerous diversion structures loaded into HydroBase and that a refined subset criteria is necessary. If a subset criteria option results in too numerous of diversion structures, the Wizard will provide a message and allow the user to redefine the criteria. The resulting structure list can be sorted by clicking on the header label.
Select and highlight a single structure from the structure list. Click on the View structure info to view structure and diversion class information. If in Step 1, the user checked the box to use diversion data from HydroBase for the selected structure, the user is able to select a structure and preview the total diversion data by clicking on the View DivTotal. The Wizard defaults to use structure total diversions, however the user can use the radio controls to select either total diversions or select individual diversion classes. See the following paragraph for a discussion on using diversion classes. If in Step 1, the user unchecked the box to use diversion data from HydroBase, the user will be unable to view or select diversion data and diversions will be set to zero in the direct diversion data file (*.ddh). If in Step 1, the user unchecked both boxes to use crop and diversion data from HydroBase, the Wizard allows the user to create a scenario for a new structure or location. See Section 2.4.2.1 for a discussion on this feature.
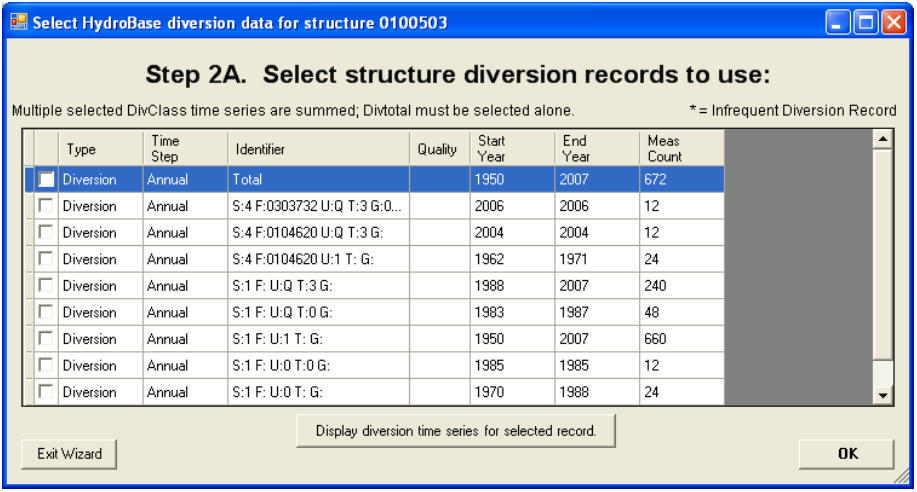
In Step 1, the user checked the box to use diversion data from HydroBase for the selected structure, the user can utilize diversion classes to create the direct diversion data file. After selecting the structure from the list, select the Select div classes radio control and then click the Continue button. This will prompt the Wizard to activate the Step 2A window (Figure 13), in which the user can select specific diversion classes. Preview the diversion class data by checking a diversion class from the list and clicking on the Display diversion time series for selected record button. Review the period of record and measured count of the data to determine the extent of the data available for the diversion class. See Chapter VIII of the Water Commissioner Handbook for information on diversion class coding. Select one or more diversion classes and click OK. The selected diversion classes are summed and will over-ride the default of total diversions. If no diversion classes are selected in Step 2A, the default of total diversions will be used.
Figure 12 - Step 2 of Wizard - Diversion Structure Selection (see also the full-size image)
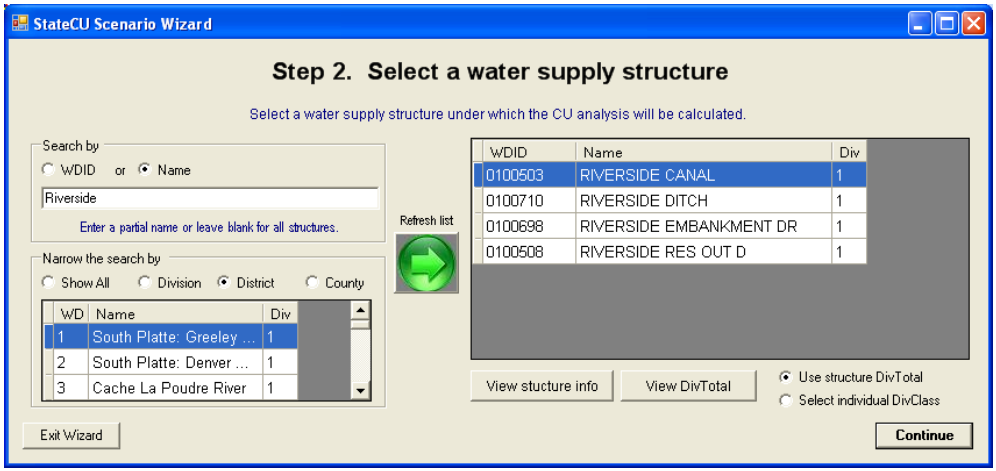
Figure 13 - Step 2A of Wizard - Diversion Class Selection (see also the full-size image)
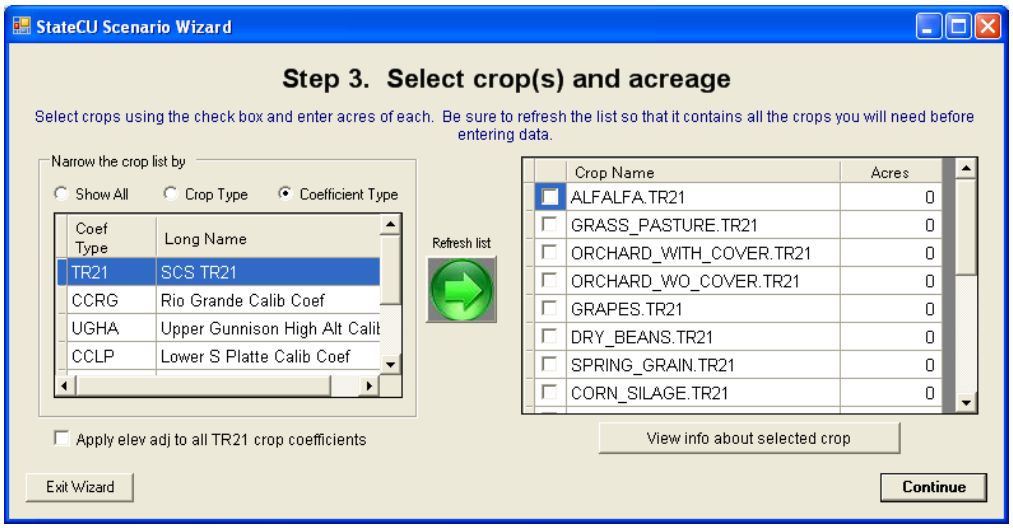
Step 3 of the Wizard (Figure 14) determines which crop(s) will be used in the analysis. Crops, and their respective characteristics, that are currently loaded in HydroBase are the only crops available for inclusion in the scenario through the Wizard. Note that although acreage and crops can vary over time, the Wizard uses the single ‘snapshot’ of the most current CDSS acreage assessment data in this step and applies them to all years in the scenario. This data can be edited in the GUI to represent changes in cropping practices.
If in Step 1, the user checked the box to use crop data from HydroBase for the selected structure, the Wizard automatically displays the most recent GIS crop information from HydroBase in the crop selection window. The user can choose to keep the default HydroBase crop information or edit the crops or acreage as needed. No subset options exist and the green refresh arrow is disabled if the Step 1 box is checked, however all available crops are listed and can be used in the scenario. Note that the Wizard can only create a scenario using TR.21 coefficients, therefore if HydroBase has a non-TR.21 crop assigned to a specific structure the Wizard will translate these crops according to the following chart.
| HydroBase Crop | Translated Wizard Crop |
|---|---|
| Corn | Corn_Grain.TR21 |
| Small Grains | Spring_Grain.TR21 |
| Sod Farm | Grass_Pasture.TR21 |
| Sunflower | Spring_Grain.TR21 |
| Wheat | Spring_Grain.TR21 |
If in Step 1 the user unchecked the box to use crop data from HydroBase, the user can narrow the list by using the radio controls, indicating a subset by crop type (e.g. alfalfa, grass pasture, corn) or a subset by crop coefficient type (e.g. SCS TR21, Rio Grande calibrated coefficient). Refresh the available list of crops based on the subset criteria by clicking on the green arrow in the center of the window. The resulting crop name list can be sorted by clicking on the header label. Note the subset criteria and the resulting crop name list must include all of the crops for inclusion into the scenario. For example, if the user wants to determine the consumptive use for both Alfalfa.TR21 and Grass_Pasture.DWHA, the subset criteria would be set to ‘None’ so that both crop names would appear in the crop name list. Selected crops and percentages are lost if the crop name list is refreshed.
Use the check boxes to select crops to be entered in the scenario, and enter the associated acreage. To view crop characteristics for any of the listed crops, check the box next to the crop name and then click on the View info about selected crop button. This will activate a window listing the crop information. The user can not edit the crop information in this window; once the scenario has been created, the user can edit this information through the GUI. The user can also choose to apply an elevation adjustment to all TR21 Crop Coefficients, using the check box in the lower left corner of the window. The adjustment is applied to all TR21 crops selected by the user for inclusion in the scenario. Elevation adjustment preferences can also be edited through the GUI. Click on the Continue button after entering all the crop data to move to the next step.
Figure 14 - Step 3 of Wizard - Crop Selection (see also the full-size image)
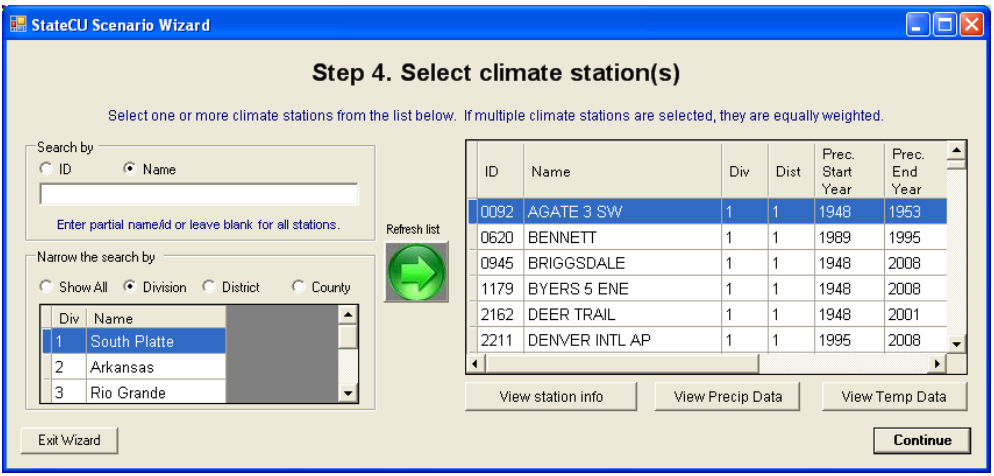
Step 4 of the Wizard (Figure 15) determines which climate station(s) will be used in the analysis. The Structure Scenario will only include one consumptive use location, however data from multiple climate stations can be used to determine the consumptive use. If multiple climate stations are selected, the Wizard equally weights the climate data from the multiple climate stations for the analysis.
Climate stations, and their climate data, that are currently loaded in HydroBase are the only stations available for inclusion in the scenario through the Wizard. The user can either search by the name of the climate station or by the ID. To search by name, enter the name or partial name of a climate station and the subset criteria. Narrow the name search by County, by Division or by Water District, or search all available climate stations by indicating ‘Show All’. Click on the green arrow in the center of the window to refresh the list. To search by climate station ID, enter the full 4 digit or partial ID and click on the green arrow. No subset criteria are allowed when searching by ID. The resulting climate station list can be sorted by clicking on the header label.
Note the subset criteria and the resulting climate station list must include all of the climate stations to be included in the scenario. For example, if the user wants to determine the consumptive use using both Greeley and Denver data, the subset criteria could be set to ‘Division’ with the ‘Name’ box left blank so that both station names would appear in the climate station list. Selected stations are lost if the climate station list is refreshed.
Select and highlight one or more climate stations for inclusion in the scenario. Click on the View station info button to view climate station location information. It is recommended that the user review the start and end years, as well as the measured count of data for each climate data type to determine the extent of available data. Click on the View Precip Data and View Temp Data buttons to preview the available climate data. The user can not edit the climate data in these windows; once the scenario has been created, the user can edit the climate data or fill missing climate data through the GUI. Note that some climate stations may have only precipitation data or only temperature data (not both); therefore using such climate stations in a scenario would not produce analysis results. Click on the Continue button after selecting all climate stations to move to the next step.
Figure 15 - Step 4 of Wizard - Climate Station Selection (see also the full-size image)
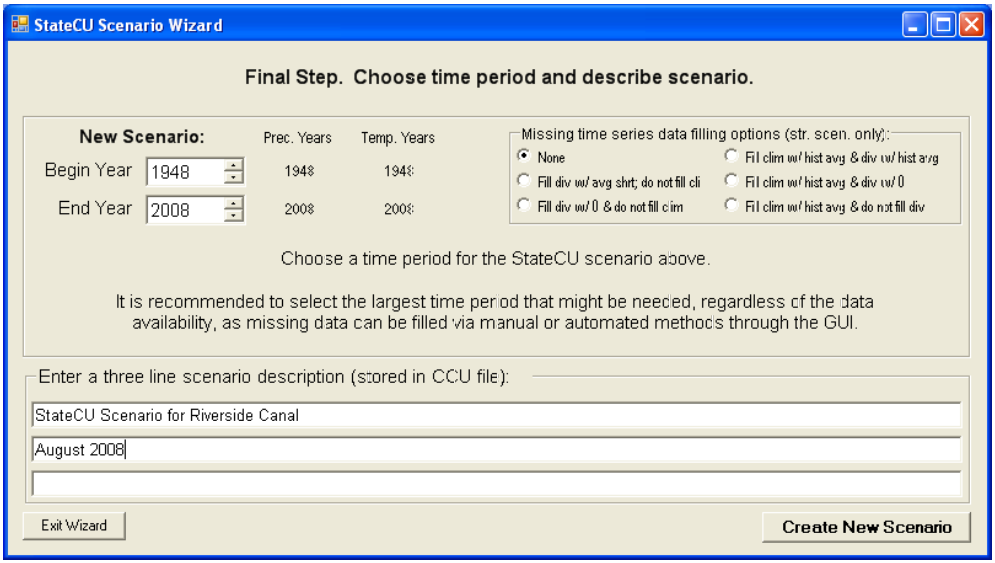
After completing the climate station selection in Step 4 of the Wizard, the user has determined all of the input parameters necessary to create a Structure Scenario. The Final Step of the Wizard (Figure 16) is to set the beginning and ending year of the analysis and enter a description of the scenario. Note that all time series data files will be created using these time period parameters. Through the GUI, an analysis can be adjusted to a smaller time period, but not a larger period, therefore it is recommended to define this period as large as available data can support. Missing data in the input files is indicated by -999. The user can choose to have StateCU fill missing data ‘on-the-fly’ with month averages or zeros through selecting Missing time series data fill options in the Final Step. Note that ‘on-the-fly’ filling will fill the missing data for the consumptive use calculations only; the original input file data will remain unchanged. Consumptive use calculations can not be performed for years with any missing data. When creating the Structure Scenario, the time period defaults to the beginning and ending year of available diversion data for the diversion structure. Edit the years by typing over the default or using the up and down arrows.
Enter a description of the scenario in the three allotted lines, maximum of 120 characters per line. This information is stored in the header of the model control options file (*.ccu). Select the Create New Scenario to complete the creation of the scenario.
Figure 16 - Final Step of Wizard - Create New Scenario (see also the full-size image)
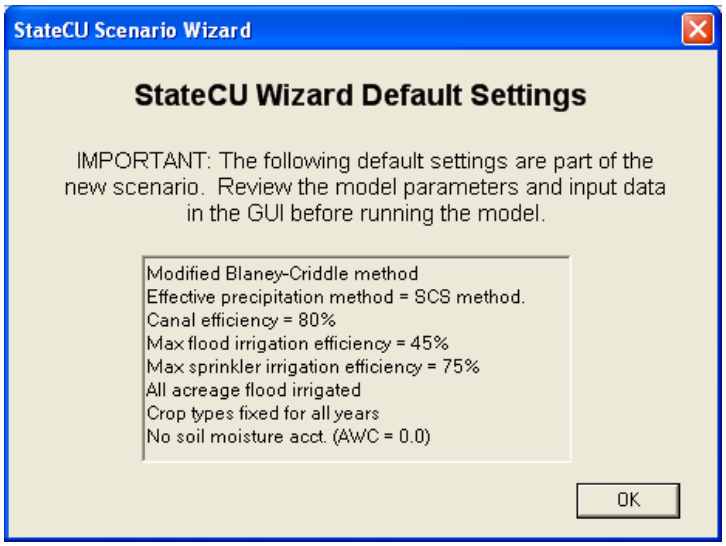
Several parameters and modeling options are not specifically input by the user into the Wizard, rather it is the responsibility of the user to review and edit these parameters through the GUI. The Wizard sets these parameters to defaults when creating the scenario. The default settings are listed in a window (Figure 17) that is activated once the scenario is created. The following is a list of these defaults settings:
- The Modified Blaney-Criddle consumptive use analysis method is set
- The effective precipitation method is set to the SCS method.
- Crop types and crop acreages is fixed for all years
- Canal efficiencies are set to 80%
- Acreage is all set to be flood irrigated and crop types are fixed for all years (non-variable)
- The maximum flood irrigation efficiency is set to 45%
- The maximum sprinkler irrigation efficiency is set to 75%
- No soil moisture accounting and structure available water capacity is set to zero
Figure 17 - Structure Scenario Wizard Default Settings (see also the full-size image)
2.4.2.1 - Create New Non-HydroBase Structure Scenario
The Wizard has the ability to create an operational and complete Structure Scenario for a user-specified structure or location not using information from HydroBase. The process to create this new scenario is similar to the process outlined in Section 2.4.2, except the user defines the structure ID. The main differences between the two processes take place in Step 1 and Step 2, therefore this discussion will focus on these differences. It is recommended the user thoroughly read Section 2.4.2 prior to creating a new nonHydroBase structure scenario.
In Step 1 of the Wizard (Figure 6), use the radio controls to select the Structure Scenario under analysis type and uncheck both of the boxes indicating not to use crop acreage and diversion data from HydroBase. Enter a new scenario name, avoiding special characters, spaces or periods in the file name then click on the Continue button to move to the next step.
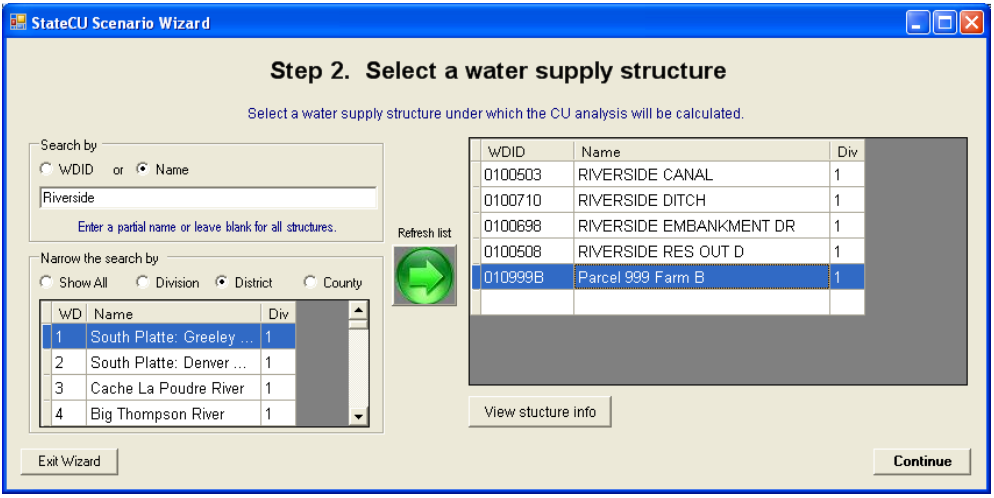
In Step 2 of the Wizard (Figure 18), there will be an empty line at the bottom of the structure list. Enter the water district structure ID (WDID) in the first box in the bottom line. The WDID can be a maximum of 12 characters with no spaces and no periods. It is recommended that the first 2 digits of the WDID reflect the Water District in which the structure is located. If no WDID is entered, ‘Field1’ will be used as the WDID. Enter the Name in the second box of the bottom line (maximum of 40 characters) that briefly describes the new structure. Enter the numeric Water Division in which the structure is located. Note that only one new structure can be included in the scenario. By default, the direct diversion file will reflect zero diversions for the newly created structure. Highlight the new structure line and click on the Continue button to move to the next step. The remaining steps in creating a new non-HydroBase structure scenario are the same as outlined in Section 2.4.2. As with Structure Scenarios created from HydroBase, it is the user’s responsibility to review and edit input data through the GUI to obtain accurate results.
Figure 18 - Example New Non-HydroBase Structure Scenario (see also the full-size image)