TSTool / Command / CreateEnsembleFromOneTimeSeries
Overview
The CreateEnsembleFromOneTimeSeries command creates an ensemble
by splitting up a single time series into traces.
For example, a historical time series can be split into 1-year
overlapping traces that are shifted to start at the beginning of the current year.
The sequence number part of the time series identifier for each trace
is set to the year type starting year and will be shown as [Year]
at the end of the time series identifier.
The data transfer will retain a continuous record.
If leap years are encountered, the output may be offset.
In other words, no gaps are retained, and no data are discarded due to leap years.
Command Editor
The following dialog is used to edit the command and illustrates the syntax of the command.
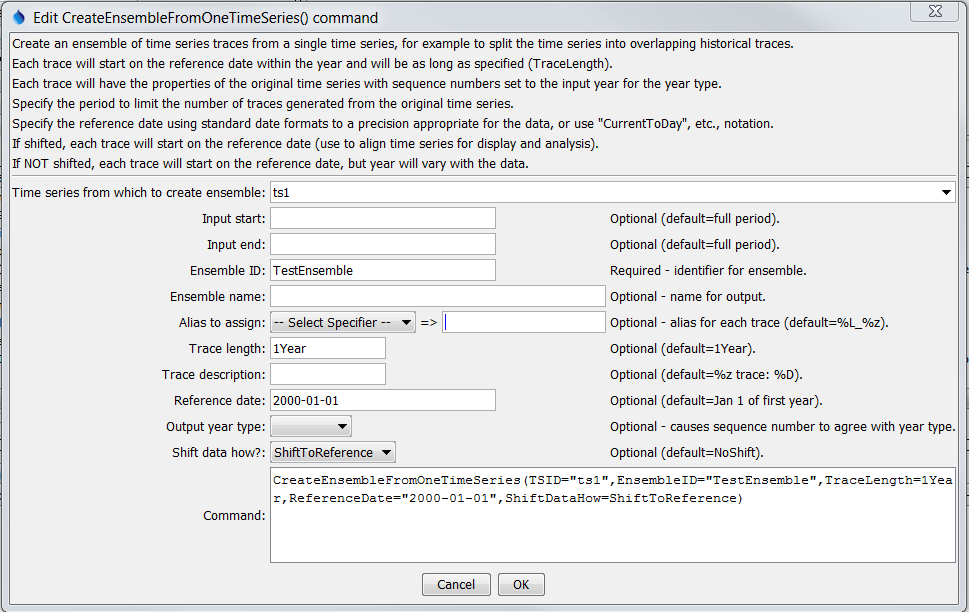
CreateEnsembleFromOneTimeSeries Command Editor (see also the full-size image)
Command Syntax
The command syntax is as follows:
CreateEnsembleFromOneTimeSeries(Parameter="Value",...)
Command Parameters
| Parameter | Description | Default |
|---|---|---|
TSIDrequired |
The time series identifier or alias for the time series used to create the ensemble. Can be specified using ${Property}. |
None – must be specified. |
InputStart |
The date/time to start transferring data from the time series. Can be specified using ${Property}. |
Use all data. |
InputEnd |
The date/time to end transferring data from the time series. Can be specified using ${Property}. |
Use all data. |
EnsembleIDrequired |
The new ensemble identifier. Can be specified using ${Property}. |
None – must be specified. |
EnsembleName |
The name for the new ensemble. Can be specified using ${Property}. |
Blank. |
Alias |
The alias to assign to the time series, as a literal string or using the special formatting characters listed by the command editor. The alias is a short identifier used by other commands to locate time series for processing, as an alternative to the time series identifier (TSID). Can be specified using ${Property}. |
%L_%z (location_sequence number) |
TraceLength |
An interval for the trace length (e.g., 1Year, 1Month or, 7Day). |
1Year |
TraceDescription |
Specify the description to be used for the output traces, using the time series property specifiers %z, etc. |
%z trace: %D |
ReferenceDate |
The reference date indicates the starting date for each trace. Each trace optionally can be shifted (see ShiftDataHow), in which case the year in the ReferenceDate is used for the common starting date. The reference date can be one of:
|
January 1 of the first year in the source time series. |
OutputYearType |
The output year type for the ensemble traces. The only impact from this parameter is that sequence number for the time series will be set to the start of the output year. This is useful because legends on graphs that use the sequence number (%z format specifier) will use the appropriate year type. The ReferenceDate should normally be specified as the first day of the output year (e.g., ReferenceDate=2012-10-01 for OutputYearType=Water). |
Calendar |
ShiftDataHow |
Indicates whether the traces should be shifted. Possible values are:
|
NoShift |
Examples
See the automated tests.
A sample command file to read a time series from the State of Colorado’s HydroBase database and create an ensemble from the time series is as follows:
# 09019500 - COLORADO RIVER NEAR GRANBY
09019500.USGS.Streamflow.Day~HydroBase
CreateEnsembleFromOneTimeSeries(TSID="09019500.USGS.Streamflow.Day",TraceLength=1Year,EnsembleID="Ensemble_1",EnsembleName="Test Ensemble",ReferenceDate="2008-01-01",ShiftDataHow=ShiftToReference)
The following figure illustrates a graph of the resulting ensemble:
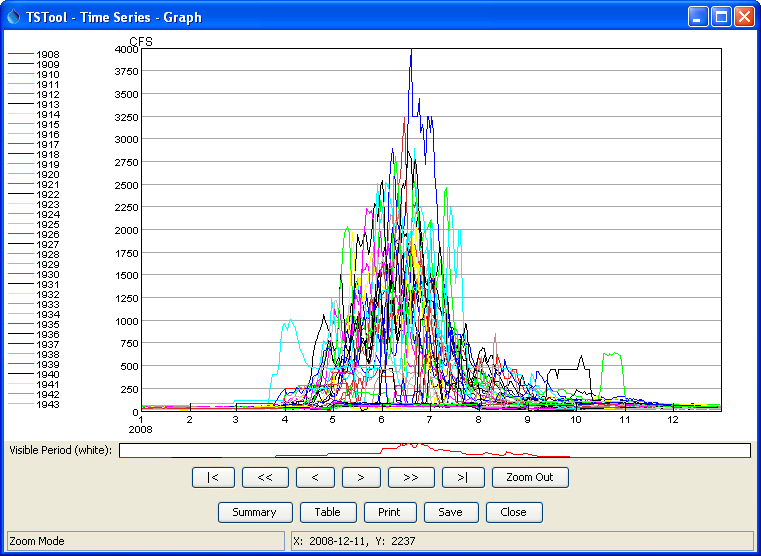
CreateEnsembleFromOneTimeSeries Example Graph (see also the full-size image)
Troubleshooting
See Also
NewEnsemblecommand