TSTool / Command / NewStatisticYearTS
Overview
The NewStatisticYearTS command creates a new year-interval time series,
where each yearly value in the resulting time series contains a statistic
determined from the sample of points from the corresponding year in the original time series.
For example, if the original time series has a daily time step,
then the sample that is analyzed will contain 365 or 366 values (depending on leap year).
Calendar years are used by default; however, the OutputYearType parameter can be used to
specify that different year types are analyzed.
For hourly and finer interval, values are considered to be in a year when the year in the date/time matches the year of interested. This may lead to some issues if the last value in a year is actually recorded at hour 0 or later of the following year.
See also the Statistic Examples for a list of commands that calculate statistics.
Command Editor
The following dialog is used to edit the command and illustrates the syntax of the command for input parameters.
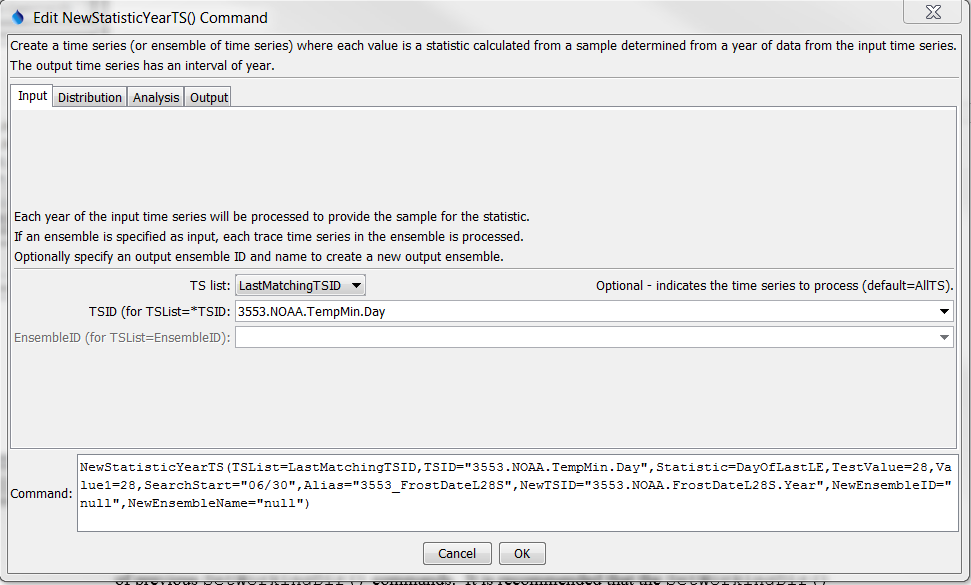
NewStatisticYearTS Command Editor (see also the full-size image)
The following dialog is used to edit the command and illustrates the syntax of the command for distribution parameters.
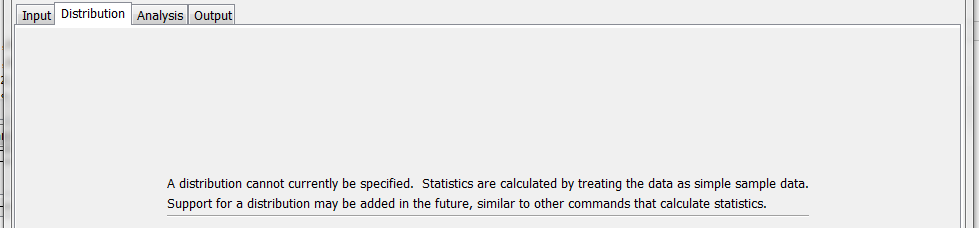
NewStatisticYearTS Command Editor for Distribution Parameters (see also the full-size image)
The following dialog is used to edit the command and illustrates the syntax of the command for analysis parameters.
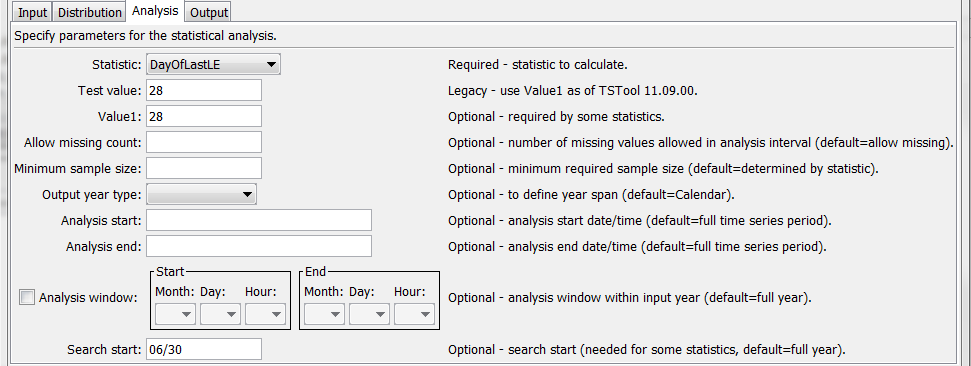
NewStatisticYearTS Command Editor for Analysis Parameters (see also the full-size image)
The following dialog is used to edit the command and illustrates the syntax of the command for output parameters.
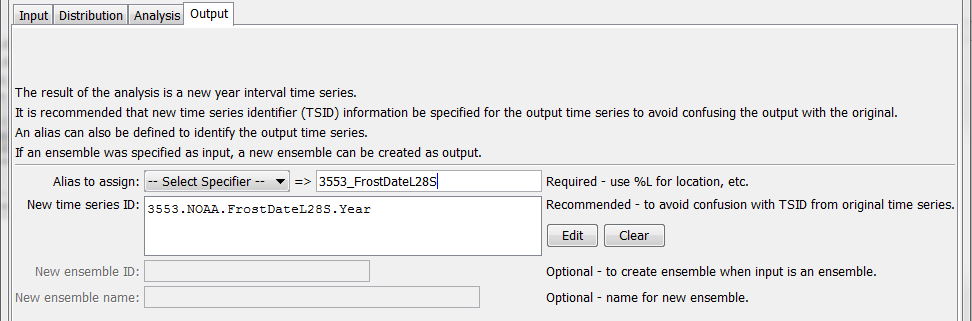
NewStatisticYearTS Command Editor for Output Parameters (see also the full-size image)
Command Syntax
The command syntax is as follows:
NewStatisticYearTS(Parameter="Value",...)
The following older command syntax is updated to the above syntax when a command file is read:
TS Alias = NewStatisticYearTS (Parameter=value,…)
Command Parameters
| Parameter | Description | Default |
|---|---|---|
TSList |
Indicates the list of time series to be processed, one of:
|
AllTS |
TSID |
The time series identifier or alias for the time series to be processed, using the * wildcard character to match multiple time series. Can be specified using ${Property}. |
Required if TSList=*TSID |
EnsembleID |
The ensemble to be processed, if processing an ensemble. Can be specified using ${Property}. |
Required if TSList=*EnsembleID |
Statisticrequired |
See the Available Statistics table below. | None – must be specified. |
TestValue |
A test value used when analyzing the statistic. This parameter is being phased out – instead use Value1. |
This parameter is required for some statistics and not used for others. See the statistics table below. |
Value1 |
Value needed by statistic. | See the statistics table below. |
AllowMissingCount |
The number of missing values allowed in the source interval(s) in order to produce a result. If an analysis window is specified (default is to analyze full years), then missing values outside of the analysis window are not considered as missing. Gaps at the end of the time series will be considered missing if within the analysis window. | Allow any number of missing values. |
MinimumSampleSize |
The minimum sample size in order to compute the statistic. | No minimum, although the statistic may have requirements. |
OutputYearType |
The output year type. For example, an output year type of NovToOct spans November of the previous calendar year to October of the current calendar year. All other parameters should still be specified in calendar year and the AnalysisWindowStart can have a month that is prior to the AnalysisWindowEnd month. |
Calendar |
AnalysisStart |
The starting date/time for the analysis using calendar dates (e.g., 2001-01-01), with precision consistent with the time series interval. This will limit the data being analyzed at the ends of the time series and controls the length of the output time series. The analysis period is typically set to align with years consistent with the output year type. Can specify using processor ${Property}. |
Analyze the full period, extending the period to include full years. |
AnalysisEnd |
The ending date/time for the analysis using calendar dates (e.g., 2001-01-01) , with precision consistent with the time series interval. This will limit the data being analyzed at the ends of the time series and controls the length of the output time series. The analysis period is typically set to align with years consistent with the output year type. Can specify using processor ${Property}. |
Analyze the full period, extending the period to include full years. |
AnalysisWindowStart |
The calendar date/time for the analysis start within each year. Specify using the format MM, MM-DD, MM-DD hh, or MM-DD hh:mm, consistent with the time series interval precision. A year of 2000 will be used internally to parse the date/time. Use this parameter to limit data processing within the year, for example to analyze only a season. Data will be considered missing only if missing within this analysis window. If specifying for other than calendar year, the analysis window start month may be greater than the analysis window end month. |
Analyze the full year. |
AnalysisWindowEnd |
Specify date/time for the analysis end within each year. See AnalysisWindowStart for details. |
Analyze the full year. |
SearchStart |
Within the analysis window, this indicates the starting date/time for the search. Specify using the format MM, MM-DD, MM-DD hh, or MM-DD hh:mm, consistent with the time series interval precision. A year of 2000 will be used internally to parse the date/time. This parameter is useful in cases where the processing considers seasonal aspects of the analysis window; for example, use when determining frost dates (when temperature is less than or equal to freezing) to ensure that the search starts from the middle of the normal growing season. Searches move forward in time except for the following statistics, in which case SearchStart will be the start of the search window, but will be the last value checked: DayOfLast*, MonthOfLast*. |
Use the analysis window start and end. Search forward for most statistics. Search backward for DayOfLast* and MonthOfLast* statistics. |
Aliasrequired |
The alias to assign to the time series, as a literal string or using the special formatting characters listed by the command editor. The alias is a short identifier used by other commands to locate time series for processing, as an alternative to the time series identifier (TSID). Can specify using processor ${Property}. |
None – must be specified. |
NewTSID |
The time series identifier to be assigned to the new time series, which is useful to avoid confusion with the original time series. Can specify using processor ${Property}. |
Use the same identifier as the original time series, with an interval of Year and a scenario matching the statistic. |
NewEnsembleID |
New ensemble identifier for results. | Ensemble is not output. |
NewEnsembleName |
Name for new ensemble. | Ensemble is not output. |
Available Statistics
The following statistics are computed from a sample determined using the analysis window.
If no analysis window is specified, then the default is to analyze complete years,
where the years correspond to the OutputYearType.
For example, for OutputYearType=NovToDec, November 1,
2000 to October 31, 2001 from the input corresponds to output year 2001.
| Statistic | Description | Limitations |
|---|---|---|
DayOfCentroid |
The day of the year (1-366) that is the centroid of the values, computed as sum(DayOfYear*value)/sum(values). |
Input time series must be daily or smaller interval. |
DayOfFirstGE |
Julian day of the year (1-366, relative to the start of the OutputYearType) for the first data value >= Value1. Searches start at the start of the analysis window and move forward. |
Input time series must be daily or smaller interval. |
DayOfFirstGT |
Similar to DayOfFirstGE, for values > Value1. |
Input time series must be daily or smaller interval. |
DayOfFirstLE |
Similar to DayOfFirstGE, for values <= Value1. |
Input time series must be daily or smaller interval. |
DayOfFirstLT |
Similar to DayOfFirstGE, for values < Value1. |
Input time series must be daily or smaller interval. |
DayOfLastGE |
Julian day of the year (1-366, relative to the start of the OutputYearType) for the last data value >= Value1. Searches start at the start of the analysis window and move backward. |
Input time series must be daily or smaller interval. |
DayOfLastGT |
Similar to DayOfLastGE, for values > Value1. |
Input time series must be daily or smaller interval. |
DayOfLastLE |
Similar to DayOfLastGE, for values <= Value1. |
Input time series must be daily or smaller interval. |
DayOfLastLT |
Similar to DayOfLastGE, for values < Value1. |
Input time series must be daily or smaller interval. |
DayOfMax |
Julian day of the year (1-366, relative to the start of the OutputYearType) for the first maximum value in the time series. |
Input time series must be daily or smaller interval. |
DayOfMin |
Julian day of the year (1-366, relative to the start of the OutputYearType) for the first minimum value in the time series. |
Input time series must be daily or smaller interval. |
GECount |
Count of values in a year >= Value1. |
|
GEPercent |
Percent of values in a year >= Value1, based on the total number of points in the year. |
|
GTCount |
Count of values in a year > Value1. |
|
GTPercent |
Percent of values in a year > Value1, based on the total number of points in the year. |
|
LECount |
Count of values in a year <= Value1. |
|
LEPercent |
Percent of values in a year <= Value1, based on the total number of points in the year. |
|
LTCount |
Count of values in a year < Value1. |
|
LTPercent |
Percent of values in a year < Value1, based on the total number of points in the year. |
|
Max |
Maximum value in a year. | |
Mean |
Mean of values in a year. | |
Min |
Minimum value in a year. | |
MissingCount |
Number of missing values in a year. | |
MissingPercent |
Percent of missing values in a year. | |
MonthOfCentroid |
The month of the year (1-12) that is the centroid of the values, computed as sum(MonthOfYear*value)/sum(values). |
Input time series must be monthly or smaller interval. |
MonthOfFirstGE |
Month the year (1-12, relative to the start of the OutputYearType) for the first data value >= Value1. Searches start at the start of the analysis window and move forward. |
Input time series must be monthly or smaller interval. |
MonthOfFirstGT |
Similar to DayOfFirstGE, for values > Value1. |
Input time series must be monthly or smaller interval. |
MonthOfFirstLE |
Similar to DayOfFirstGE, for values <= Value1. |
Input time series must be monthly or smaller interval. |
MonthOfFirstLT |
Similar to DayOfFirstGE, for values < Value1. |
Input time series must be monthly or smaller interval. |
MonthOfLastGE |
Month of the year (1-12, relative to the start of the OutputYearType) for the last data value >= Value1. Searches start at the end of the analysis window and move backward. |
Input time series must be monthly or smaller interval. |
MonthOfLastGT |
Similar to DayOfLastGE, for values > Value1. |
Input time series must be monthly or smaller interval. |
MonthOfLastLE |
Similar to DayOfLastGE, for values <= Value1. |
Input time series must be monthly or smaller interval. |
MonthOfLastLT |
Similar to DayOfLastGE, for values < Value1. |
Input time series must be monthly or smaller interval. |
MonthOfMax |
Month of the year (1-12, relative to the start of the OutputYearType) for the first maximum value in the time series. |
Input time series must be monthly or smaller interval. |
MonthOfMin |
Month of the year (1-12, relative to the start of the OutputYearType) for the first minimum value in the time series. |
Input time series must be monthly or smaller interval. |
NonMissingCount |
Number of non-missing values in a year. | |
NonMissingPercent |
Percent of non-missing values in a year. | |
Total |
Total of values in a year. |
Examples
See the automated tests.
The following example commands file computes the last spring frost date for 28 degrees and 32 degrees, searching backwards from June 30 each year, and the first fall frost date for 32 and 28 degrees, searching forwards from July 1 each year:
StartLog(LogFile="FrostDates_HydroBase.log")
SetOutputPeriod(OutputStart="1950-01",OutputEnd="2004-12")
# 3553 - GREELEY UNC
3553.NOAA.TempMin.Day~HydroBase
NewStatisticYearTS(TSID="3553.NOAA.TempMin.Day",Alias=”3553_FrostDateL28S”,NewTSID="3553.NOAA.FrostDateL28S.Year",Statistic=DayOfLastLE,Value1=28,SearchStart="06/30")
NewStatisticYearTS(TSID="3553.NOAA.TempMin.Day",Alias=” FrostDateL32S”,NewTSID="3553.NOAA.FrostDateL32S.Year",Statistic=DayOfLastLE,Value1=32,SearchStart="06/30")
NewStatisticYearTS(TSID="3553.NOAA.TempMin.Day",Alias=”3553_FrostDateF32F”,NewTSID="3553.NOAA.FrostDateF32F.Year",Statistic=DayOfFirstLE,Value1=32,SearchStart="07/01")
NewStatisticYearTS(TSID="3553.NOAA.TempMin.Day",Alias=”3553_FrostDateF28F”,NewTSID="3553.NOAA.FrostDateF28F.Year",Statistic=DayOfFirstLE,Value1=28,SearchStart="07/01")
Free(TSID="*.*.TempMin.*")
WriteStateCU(OutputFile="Results/Test.FrostDates")
Troubleshooting
See Also
- Statistic Examples
CalculateTimeSeriesStatisticcommandChangeIntervalcommandCheckTimeSeriescommands.NewStatisticMonthTimeSeriescommandNewStatisticTimeSeriescommandNewStatisticTimeSeriesFromEnsemblecommandSelectTimeSeriescommand