TSTool / Command / NewStatisticMonthTimeSeries
Overview
This command is under development.
The NewStatisticMonthTimeSeries command creates a new month interval time series,
where each monthly value in the resulting time series contains a statistic
determined from the data sample from the corresponding month in the original time series.
For example, if the original time series has a daily time step,
then the sample that is analyzed will contain 28-31 values (depending on leap year and month).
For hourly and finer interval, values are considered to be in a month when the month in the date/time matches the month of interested. This may lead to some issues if the last value in a month is actually recorded at hour 0 or later of the following month. Handling other than daily data is not yet implemented.
See also the Statistic Examples for a list of commands that calculate statistics.
Command Editor
The following dialog is used to edit the command and illustrates the syntax of the command.
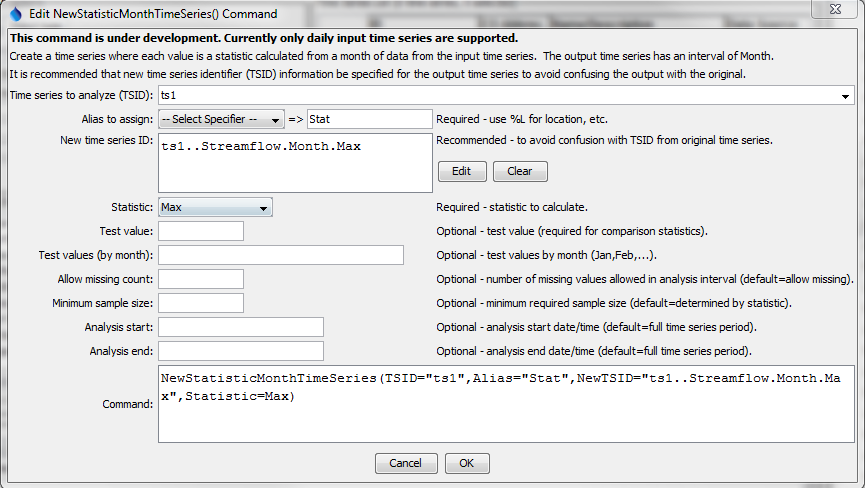
NewStatisticMonthTimeSeries Command Editor (see also the full-size image)
Command Syntax
The command syntax is as follows:
NewStatisticMonthTimeSeries(Parameter="Value",...)
Command Parameters
| Parameter | Description | Default |
|---|---|---|
TSIDrequired |
The time series identifier (or alias) of the time series to analyze. In the future this command will support processing multiple time series. | None – must be specified. |
Aliasrequired |
The alias to assign to the output time series, as a literal string or using the special formatting characters listed by the command editor (which will use properties of the input time series). The alias is a short identifier used by other commands to locate time series for processing, as an alternative to the time series identifier (TSID). |
None – must be specified. |
NewTSID |
The time series identifier to be assigned to the new time series, which is useful to avoid confusion with the original time series. | Use the same identifier as the original time series, with an interval of Month and a scenario matching the statistic. |
Statisticrequired |
See the Available Statistics table below. | None – must be specified. |
TestValue |
A test value used when analyzing the statistic. | This parameter is required for some statistics and not used for others. See the statistics table below. |
MonthTestValues |
Twelve monthly test values separated by commas, with January’s value first. | Single test value will be used. |
AllowMissingCount |
The number of missing values allowed in the source interval(s) in order to produce a result. | Allow any number of missing values. |
MinimumSampleSize |
The minimum sample size in order to compute the statistic. | No minimum, although the statistic may have requirements. |
AnalysisStart |
The starting date/time for the analysis using calendar dates (e.g., 2001-01), with month precision. This will limit the data being analyzed and defines the output period. | Analyze the full period, extending the period to include full months. |
AnalysisEnd |
The starting date/time for the analysis using calendar dates (e.g., 2001-01), with month precision. This will limit the data being analyzed and defines the output period. | Analyze the full period, extending the period to include full months. |
The following statistics are computed from a sample determined from each of data from the input time series.
Available Statistics
| Parameter | Description | Limitations |
|---|---|---|
DayOfCentroid |
The day of the month (1-31) that is the centroid of the values, computed as sum(DayOfMonth*value)/sum(values). |
Input time series must be daily or smaller interval. |
DayOfFirstGE |
Day of the month (1-31) for the first data value >= TestValue. |
Input time series must be daily or smaller interval. |
DayOfFirstGT |
Similar to DayOfFirstGE, for values > TestValue. |
Input time series must be daily or smaller interval. |
DayOfFirstLE |
Similar to DayOfFirstGE, for values <= TestValue. |
Input time series must be daily or smaller interval. |
DayOfFirstLT |
Similar to DayOfFirstGE, for values < TestValue. |
Input time series must be daily or smaller interval. |
DayOfLastGE |
Day of the month (1-31) for the last data value >= TestValue. |
Input time series must be daily or smaller interval. |
DayOfLastGT |
Similar to DayOfLastGE, for values > TestValue. |
Input time series must be daily or smaller interval. |
DayOfLastLE |
Similar to DayOfLastGE, for values <= TestValue. |
Input time series must be daily or smaller interval. |
DayOfLastLT |
Similar to DayOfLastGE, for values < TestValue. |
Input time series must be daily or smaller interval. |
DayOfMax |
Day of the month (1-31) for the first maximum value in the time series. | Input time series must be daily or smaller interval. |
DayOfMin |
Day of the month (1-31) for the first minimum value in the time series. | Input time series must be daily or smaller interval. |
GECount |
Count of values in a month >= TestValue. |
|
GEPercent |
Percent of values in a month >= TestValue, based on the total number of points in the month. |
|
GTCount |
Count of values in a month > TestValue. |
|
GTPercent |
Percent of values in a month > TestValue, based on the total number of points in the month. |
|
LECount |
Count of values in a month <= TestValue. |
|
LEPercent |
Percent of values in a month <= TestValue, based on the total number of points in the month. |
|
LTCount |
Count of values in a month < TestValue. |
|
LTPercent |
Percent of values in a month < TestValue, based on the total number of points in the month. |
|
Max |
Maximum value in a month. | |
Mean |
Mean of values in a month. | |
Min |
Minimum value in a month. | |
MissingCount |
Number of missing values in a month. | |
MissingPercent |
Percent of missing values in a month. | |
NonMissingCount |
Number of non-missing values in a month. | |
NonMissingPercent |
Percent of non-missing values in a month. | |
Total |
Total of values in a month. |
Examples
See the automated tests.
Troubleshooting
See Also
- Statistic Examples
CalculateTimeSeriesStatisticcommandCheckTimeSeriescommands.NewStatisticTimeSeriescommandNewStatisticTimeSeriesFromEnsemblecommandNewStatisticYearTScommandSelectTimeSeriescommand