TSTool / Command / Cumulate
Overview
The Cumulate command converts a time series into cumulative values, which is useful for:
- comparing the cumulative trends of related time series (e.g., nearby gages or precipitation gages) and can serve as a substitute for the double-mass graph, which typically plots time series against each other on the X and Y axis
- checking mass balance when routing time series (the cumulative values before and after routine will track closely)
- computing year-to-date totals such as cumulative precipitation
Cumulate Without Reset
The default behavior is to cumulate the values without resetting, which results in an ever-increasing total of the data values. This behavior is appropriate when reviewing the long-term trend, for example to see if precipitation at a station is generally consistent over time. Any noticeable deviation in the slope of the cumulative time series indicates a sudden or cumulative change in values.
Cumulate With Reset
A reset date/time can be applied, which causes cumulative values to reset to a new starting value once each year,
resulting in a "sawtooth" pattern.
The Reset parameter, which does not include year,
indicates the first date/time of the new year,
and by default the cumulative value will be initialized to the data value for that interval.
Note that prior to TSTool 14.4.0 the default was 0,
but this ignores the first interval's value in the cumulative value.
Because values are being accumulated,
the reset date/time should be the first interval-ending time in the new year,
with behavior as shown in the following table.
The AllowMissingCount and MinimumSampleSize parameters provide
control over data quality for the values for a year.
Irregular time series may have values at any time
and therefore AllowMissingCount and MinimumSampleSize are applied only to actual data points.
The Reset value should be specified as the first ending (at) interval in the new year,
with appropriate precision for the date/times used in the irregular time series.
Reset Behavior for Time Series Intervals
| Interval | Example Reset |
Description |
|---|---|---|
Year |
Reset should not be used because it provides no additional information. | |
Month |
|
The last cumulative value will be on the twelfth month (e.g., 12 for calendar year) and the end-of-year value will by default be the sum of 12 month values. |
Day |
|
The last cumulative value will be on the last day of the year (e.g., December 31 for calendar year) and the end-of-year value will by default be the sum of 365 (or 366 if a leap year) day values. |
Hour |
|
The last cumulative value in a year will be at midnight (equivalent to hour 24) of the last day of the year. The first cumulative value in a year will be at interval ending (at) hour 1. |
Minute |
|
The last cumulative value in a year will be at midnight (equivalent to hour 24) of the last day of the year. The first cumulative value in a year will be at interval ending (at) minute 1. |
IrregSecond |
|
The last cumulative value will be at midnight (equivalent to hour 24) of the last day of the year. The first cumulative value in a year will be at the first date/time encountered in the year. If necessary, a new data point will be inserted at the reset date/time with value of 0.0. |
The handling of reset for time series data intervals that involve time may
not seem intuitive because hour 0 of the first day of the next year is included in the last year.
For example, see the highlighted values in the following figure.
This behavior is because the date/time 2000-01-01 00 is equivalent to 1999-12-31 24,
which is the end of the last interval of the year.
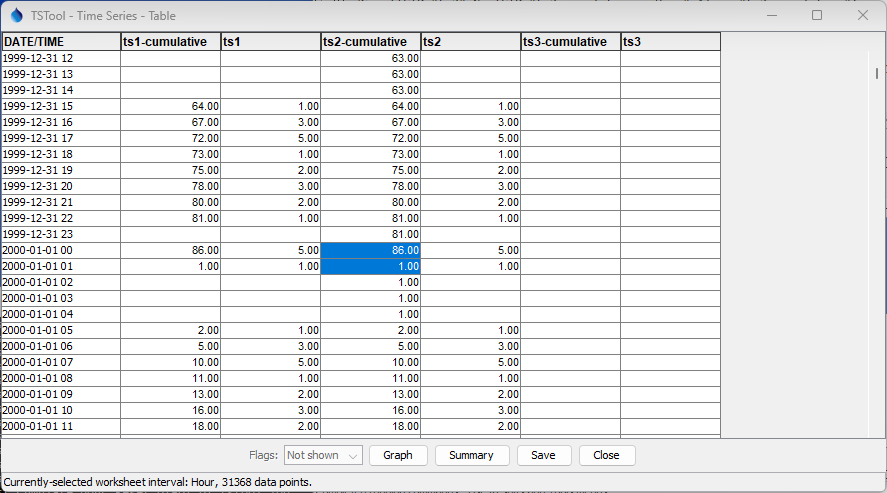
Cumulate Results for Hourly Data with Reset (see also the full-size image)
The reset for irregular interval time series may lead to the first value in the year being
at a time that is significantly after the reset time.
The InsertResetPoint=True parameter can be used to insert a zero data point at the Reset date/time
if a data point does not exist, which ensures that the yearly accumulation starts at a zero value.
The following example illustrates the difference between inserting a point (and not).
If used with regular interval time series, InsertResetPoint=True will ensure that a non-missing value
is preset at the Reset date/time, using zero if the value was originally missing.
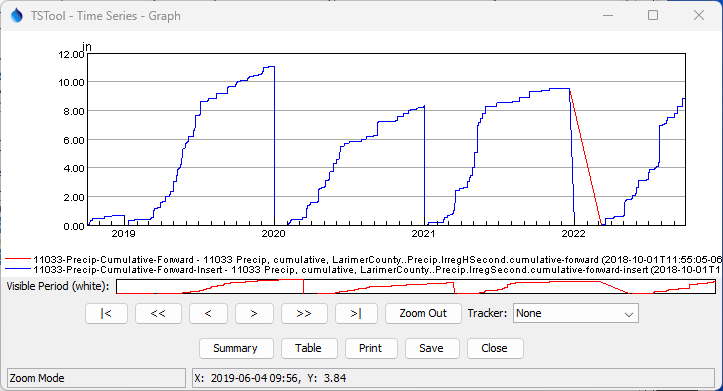
Cumulate Results for Irregular Time Series with Inserted Reset Point (see also the full-size image)
Limitations
A special case may occur for irregular time series when the time precision for data is sub-second for the first interval in a new year.
For example, a data value may exist at second 0 and non-zero fractional second in the first
interval of the new year.
If the time series interval is IrregSecond and time comparisons are made to the second,
the data value will be added to the end of the previous year, as if a midnight value.
However, the value should be added to the first second of the new year.
This error is generally negligible but could impact cumulative
values on the midnight boundaries between years.
Future software enhancements may handle this case.
Double Mass Curve Analysis
A double mass curve analysis can be used to compare sensor/station data to detect whether a change in condition has occurred at some point that is impacting data consistency. For example, nearby precipitation station data may diverge from each other at some point due to a change in equipment, physical surroundings, or other change.
The analysis may occur by comparing station time series directly, or comparing a station's time series to a basin average of multiple stations. Because time series are compared at matching date/time, the analysis of irregular interval time series requires converting to regular interval time series to perform a traditional double mass analysis.
See the following resources for double mass plots:
- Double-Mass Curves, USGS, 1960
- Analysis and Presentation of Rainfall Data
- See also the topic in many hydrology books and online videos
TSTool does not currently provide traditional double mass curve plots, where values from two time series are plotted against each other, one on the X axis and one on the Y axis. Instead, the following alternatives can be used:
- plot the cumulative time series over time as a typical time series plot, with X axis being time and Y axis being the cumulative values, and note the change in slope (can be done with regular or irregular interval time series)
- plot the cumulative time series using the XY Scatter Plot (if necessary, use commands to convert the original data to a regular interval first to allow timesteps to be aligned)
- use TSTool to process the time series into cumulative form and then write to Excel or other format for plotting
TSTool handles missing data and different data intervals that impact double mass analysis. However, additional software enhancements are needed to provide a traditional double mass plot within TSTool and to automate calculation of slope and correction factors. Such work may be difficult to automated due to the need to visually interpret breaks in the slope of lines on graphs. TSTool graph annotations can be used to indicate slope and corrections.
Command Editor
The following dialog is used to edit the command and illustrates the syntax of the command.
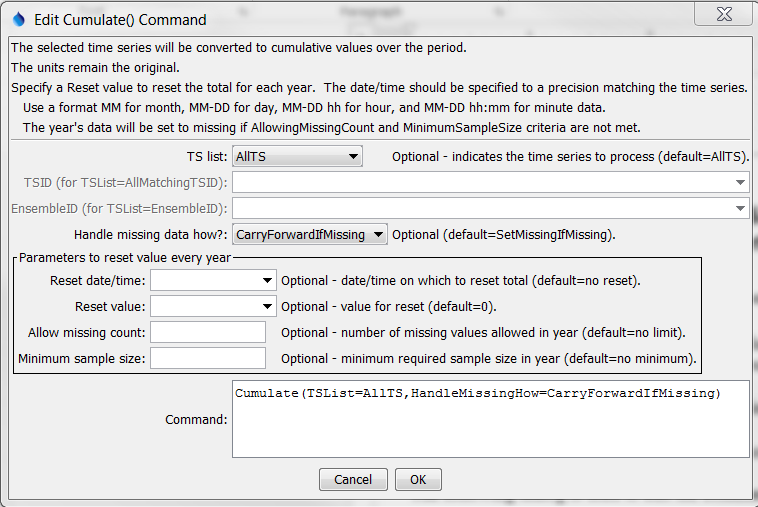
Cumulate Command Editor (see also the full-size image)
Command Syntax
The command syntax is as follows:
Cumulate(Parameter="Value",...)
Command Parameters
| Parameter | Description | Default |
|---|---|---|
TSList |
Indicates the list of time series to be processed, one of:
|
AllTS |
TSID |
The time series identifier or alias for the time series to be processed, using the * wildcard character to match multiple time series. Can be specified using ${Property}. |
Required if TSList=*TSID |
EnsembleID |
The ensemble to be processed, if processing an ensemble. Can be specified using ${Property}. |
Required if TSList=*EnsembleID |
HandleMissingHow |
Indicate how to handle missing data, one of:
For regular interval time series, a period of missing data will have a data gap in graphs. For irregular time series, non-missing data points will be connected and may span a long period. |
SetMissingIfMissing |
Reset |
A zero-padded date/time (omitting year) to the precision of the time series (e.g., 01-01 for January 1 in a daily time series and 10-01 for "water year") that indicates when to reset the cumulative value to the initial value, before beginning to cumulate again. Specifying the reset defines the first timestep in a new year, whether calendar or some other year is being used for the cumulative values. Use zero-padded values and the format MM-DD, MM-DD hh, MM-DD hh:mm, or MM-DD hh:mm:ss (for IrregSecond interval time series). Can use ${Property} notation. |
Do not reset (cumulate for the entire period). |
ResetValue |
When Reset is specified: the value to initialize the total at the Reset date/time for the year, one of:
|
DataValue (as of TSTool 14.4.0),0 (zero) (prior to TSTool 14.4.0). |
InsertResetPoint |
Insert a zero-value data point at the Reset date/time and set the data flag to RESET if the following conditions are met. This can improve visualization and provides a starting point for HandleMissingHow=CarryForwardIfMissing because a non-missing year-start value is used.For regular interval time series:
|
The first data point in the year is used for the reset. For regular time series the value may be missing, which will result in missing even if HandleMissingDataHow=CarryForwardIfMissing. For irregular time series the date/time may occur after the Reset date/time. |
AllowMissingCount |
When Reset is specified: the number of values allowed to be missing in a year. If more values are missing, the entire year is set to missing. The missing value count for the first year includes the period from analysis start to Reset. A partial year at the end of the analysis period will not count as missing beyond the analysis end. Irregular time series data values must have a missing value for the value, such as NaN. |
No limit on the number of missing values. |
MinimumSampleSize |
When Reset is specified: the minimum number of non-missing values required in a year to perform the computation. If fewer values are in the sample, the entire year is set to missing. The missing value count for the first year includes the period from analysis start to Reset. A partial year at the end of the analysis period will result in the sample size being less than the full year. | No minimum sample size is required. |
Examples
See the automated tests.
A sample command file to cumulate time series from the State of Colorado’s HydroBase database is as follows:
# 1458 - CENTER 4 SSW
1458.NOAA.Precip.Month~HydroBase
# 2184 - DEL NORTE 2 E
2184.NOAA.Precip.Month~HydroBase
Cumulate(TSList=AllTS,HandleMissingHow=CarryForwardIfMissing)
The following graph illustrates cumulative data for two precipitation gages in the same region, where missing data results in carrying forward the last known value.
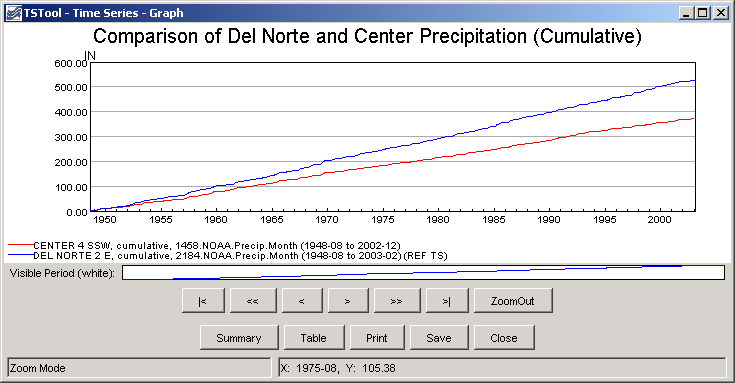
Example Graph Showing Results of Cumulate Command (see also the full-size image)
Troubleshooting
See Also
SelectTimeSeriescommand