TSTool / Command / NewStatisticTimeSeriesFromEnsemble
Overview
Work in progress is indicated below with [DEV], in some cases because software needs to be enhanced and in other cases because automated tests need written.
The NewStatisticTimeSeriesFromEnsemble command uses data from time series in an
ensemble to calculate a statistic for each interval in the ensemble,
and assigns the statistic value to the corresponding interval in the result.
For example, for a statistic of Mean applied to a daily time series,
all January 1, 1970 values will be used for the sample and the mean value will be assigned to
January 1, 1970 in the output time series.
Leap year values will be included if they are included in the period of the ensemble.
Command Editor
The following dialog is used to edit the command and illustrates the syntax for the command.
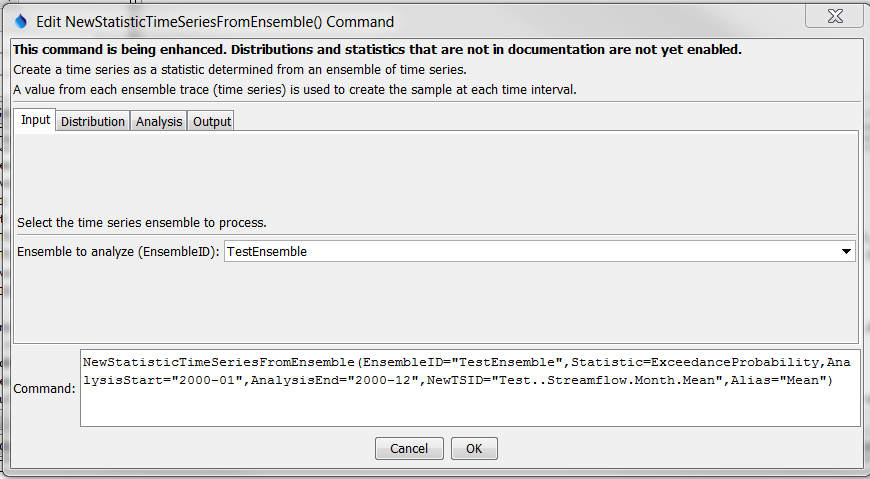
NewStatisticTimeSeriesFromEnsemble Command Editor for Input Parameters (see also the full-size image)
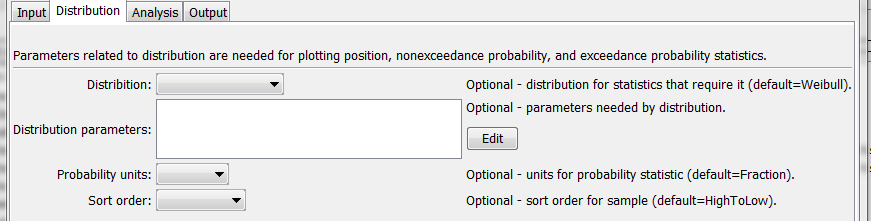
NewStatisticTimeSeriesFromEnsemble Command Editor for Distribution Parameters (see also the full-size image)
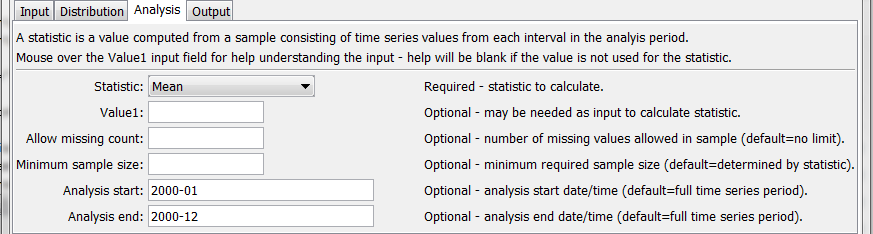
NewStatisticTimeSeriesFromEnsemble Command Editor for Analysis Parameters (see also the full-size image)
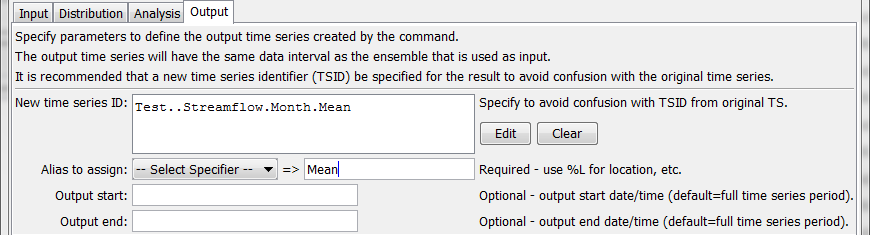
NewStatisticTimeSeriesFromEnsemble Command Editor for Output Parameters (see also the full-size image)
Command Syntax
The command syntax is as follows:
NewStatisticTimeSeriesFromEnsemble(Parameter="Value",...)
The following older command syntax is updated to the above syntax when a command file is read:
TS Alias = NewStatisticTimeSeriesFromEnsemble(Parameter=Value,...)
Command Parameters
| Parameter | Description | Default |
|---|---|---|
EnsembleID |
The identifier for the ensemble to analyze. Can be specified using ${Property} notation. |
None – must be specified. |
Distribution[DEV] |
Indicates the distribution, needed for certain statistics (see Statistics Summary table below for indication or statistics that need distribution information). See the Distribution Summary table below for information about distributions. | |
DistributionParameters[DEV] |
Additional parameters needed to specify a distribution. See the Distribution Summary table below. | |
ProbabilityUnits[DEV] |
Units to use for calculated probability statistics:
|
Fraction (0 – 1). |
Statistic |
The statistic to compute. See the Available Statistics table below. | None – must be specified. |
Value1[DEV] |
Input data required by the statistic. Currently the dialog does not check the value for correctness – it is checked when the statistic is computed. | See Statistic Details table below. |
AllowMissingCount |
The number of missing values allowed in the sample of values in order to produce a result. This capability should be used with care because it may result in data that are not representative of actual conditions. | Missing values are ignored in the sample used to compute the statistic. |
MinimumSample Size |
The minimum number of values in the sample that are required to compute the statistic. | Use the sample with no restrictions, although some statistics may have requirements. |
AnalysisStart |
The date/time for the analysis start, using a precision that matches the original time series. Can be specified using ${Property} notation. |
Analyze the full period. |
AnalysisEnd |
The date/time for the analysis start, using a precision that matches the original time series. Can be specified using ${Property} notation. |
Analyze the full period. |
NewTSID |
The time series identifier to be assigned to the new time series, which is useful to avoid confusion with the original time series. This parameter may be required in the future. Can be specified using ${Property} notation. |
None – use the same identifier as the original time series. |
Alias |
The alias to assign to the time series, as a literal string or using the special formatting characters listed by the command editor. The alias is a short identifier used by other commands to locate time series for processing, as an alternative to the time series identifier (TSID). | None – must be specified. |
Description[DEV] |
Description to assign to output time series. Can be specified using ${Property} and ${ts:Property} notation. |
Time series description with statistic, or ensemble name with statistic, as available. |
OutputStart |
The date/time for the output start, using a precision that matches the original time series. An output period longer than the analysis period will result in missing values in output. Can be specified using ${Property} notation. |
Output the full period. |
OutputEnd |
The date/time for the output start, using a precision that matches the original time series. An output period longer than the analysis period will result in missing values in output. Can be specified using ${Property} notation. |
Output the full period. |
Available Statistics
| Statistic | Description | Limitations |
|---|---|---|
ExceedanceProbability[DEV] |
The data value corresponding to an N% chance of value being exceeded. Specify the probability as a fraction using Value1. |
Small sample size will impact – see statistic details. |
ExceedanceProbability10 |
The data value corresponding to a 10% chance of value being exceeded. | Small sample size will impact – see statistic details. |
ExceedanceProbability30 |
The data value corresponding to a 30% chance of value being exceeded. | Small sample size will impact – see statistic details. |
ExceedanceProbability50 |
The data value corresponding to a 50% chance of value being exceeded. | Small sample size will impact – see statistic details. |
ExceedanceProbability70 |
The data value corresponding to a 70% chance of value being exceeded. | Small sample size will impact – see statistic details. |
ExceedanceProbability90 |
The data value corresponding to a 90% chance of value being exceeded. | Small sample size will impact – see statistic details. |
GECount[DEV] |
Count of values greater than or equal to Value1. None. |
|
GTCount[DEV] |
Count of values greater than Value1. None. |
|
GeometricMean |
Geometric mean of all values in the sample. | All values must be >= 0. |
LECount[DEV] |
Count of values less than or equal to Value1. |
None. |
LTCount[DEV] |
Count of values less than Value1. |
None. |
Max |
Maximum of all values in the sample. | None. |
Mean |
Arithmetic mean of all values in the sample. | None. |
Median |
Median of all values in the sample. | None. |
Min |
Minimum of all values in the sample. | None. |
MissingCount |
The count of values that are missing. | This statistic will be computed regardless of AllowMissingCount and MinimumSampleSize. |
MissingPercent |
The percent of values that are missing. | See above. |
NonexceedanceProbability[DEV] |
The data value corresponding to an N% chance of value being less. Specify the probability as a fraction using Value1. |
Small sample size will impact – see statistic details. |
NonexceedanceProbability10[DEV] |
The data value corresponding to a 10% chance of value being less than. | Small sample size will impact – see statistic details. |
NonexceedanceProbability30[DEV] |
The data value corresponding to a 30% chance of value being less than. | Small sample size will impact – see statistic details. |
NonexceedanceProbability50[DEV] |
The data value corresponding to a 50% chance of value being less than. | Small sample size will impact – see statistic details. |
NonexceedanceProbability70[DEV] |
The data value corresponding to a 70% chance of value being less than. | Small sample size will impact – see statistic details. |
NonexceedanceProbability90[DEV] |
The data value corresponding to a 90% chance of value being less than. | Small sample size will impact – see statistic details. |
NonmissingCount |
The count of values that are not missing. | See above. |
NonmissingPercent |
The percent of values that are not missing. | See above. |
RankAscending[DEV] |
Rank based on ascending sort order. Duplicate values are each assigned a rank that is the average of the ranks for the duplicate values. This is necessary because selecting one of the ranks would be arbitrary. A new command parameter may be added to allow control of this behavior. | None. |
RankDescending[DEV] |
Rank based on descending sort order. See RankAscending for discussion of duplicates. |
None. |
Skew[DEV] |
Skew coefficient, as follows: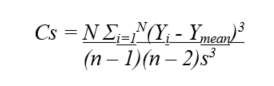 where s = standard deviation. |
None. |
StdDev[DEV] |
Sample standard deviation. | None. |
Total |
Total of values in the sample. | None. |
Statistic Details
| Statistic | Description |
|---|---|
Statistic |
Description |
ExceedanceProbability* |
The statistic for each time step in the analysis period is computed as follows:
|
Examples
See the automated tests.
The following example command file illustrates how to compute the mean statistic for one monthly data:
# Test computing a statistic time series for Month data where Statistic=Mean
StartLog(LogFile="Results/Test_NewStatisticTimeSeriesFromEnsemble_Month_Mean.TSTool.log")
# Define 2 years of data that when averaged equal even numbers
# The 2nd time series is shifted by 1 from the first.
# Include missing values in the first time series but not the second.
NewPatternTimeSeries(Alias=”ts1”,NewTSID="ts1..Streamflow.Month",Description="test data 1",SetStart="2000-01",SetEnd="2001-12",Units="CFS",PatternValues=".5,1.5,,3.5,4.5,5.5,6.5,7.5,8.5,9.5,10.5,11.5,1.5,2.5,3.5,4.5,5.5,6.5,7.5,8.5,9.5,10.5,11.5,12.5")
NewPatternTimeSeries(Alias=”ts2”,NewTSID="ts2..Streamflow.Month",Description="test data 2",SetStart="2000-01",SetEnd="2001-12",Units="CFS",PatternValues="1.5,2.5,3.5,4.5,5.5,6.5,7.5,8.5,9.5,10.5,11.5,12.5,2.5,3.5,4.5,5.5,6.5,7.5,8.5,9.5,10.5,11.5,12.5,13.5")
# Create an ensemble to hold the above time series
NewEnsemble(TSList=AllTS,NewEnsembleID="TestEnsemble",NewEnsembleName="Test Ensemble")
# Compute the statistic
NewStatisticTimeSeriesFromEnsemble(Alias=”Mean”,EnsembleID="TestEnsemble",NewTSID="Test..Streamflow.Month.Mean",Statistic=Mean)
The following figure illustrates the results:
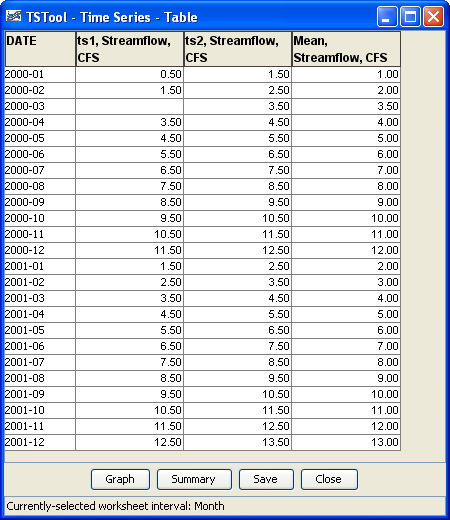
NewStatisticTimeSeriesFromEnsemble Command Editor Results (see also the full-size image)