TSTool / Tools
This chapter discusses the tools available under the Tools menu. The Tools menu lists tools that perform additional analysis on time series that are selected in the Time Series Results list. These features are similar to the Results menu features in that a level of additional analysis is performed to produce the data product. Tools may or may not correspond to commands – often tools internally execute the features available in commands, in order to implement a more complicated analysis. Tools are interactive, whereas commands can be used in automated processing. Tools are therefore appropriate for one-off interactive data viewing, and commands should be used to automate processing on large datasets.
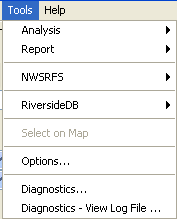
Tools Menu
Tools may be specific to a datastore type and consequently some tools may not be available in TSTool for all configurations. Where possible, TSTool functionality is included in commands to facilitate automation.
Analysis Tools
Analysis tools analyze time series and typically produce an output report.
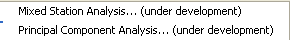
Tools / Analysis Menu
Mixed Station Analysis
The Mixed Station Analysis tool is under development and not ready for production use.
Instead, use the
FillMixedStation and
FillRegression commands,
which provide most of the functionality envisioned by the interactive tool.
The following documentation is retained for discussion purposes and to guide future enhancements.
The Mixed Station Analysis tool is an interactive tool that tries to find the best
combination of time series necessary to fill data using regression or the MOVE2 method.
The optimal results can then optionally be used as parameters for the
FillMixedStation command.
The following figure illustrates the Mixed Station Analysis tool.
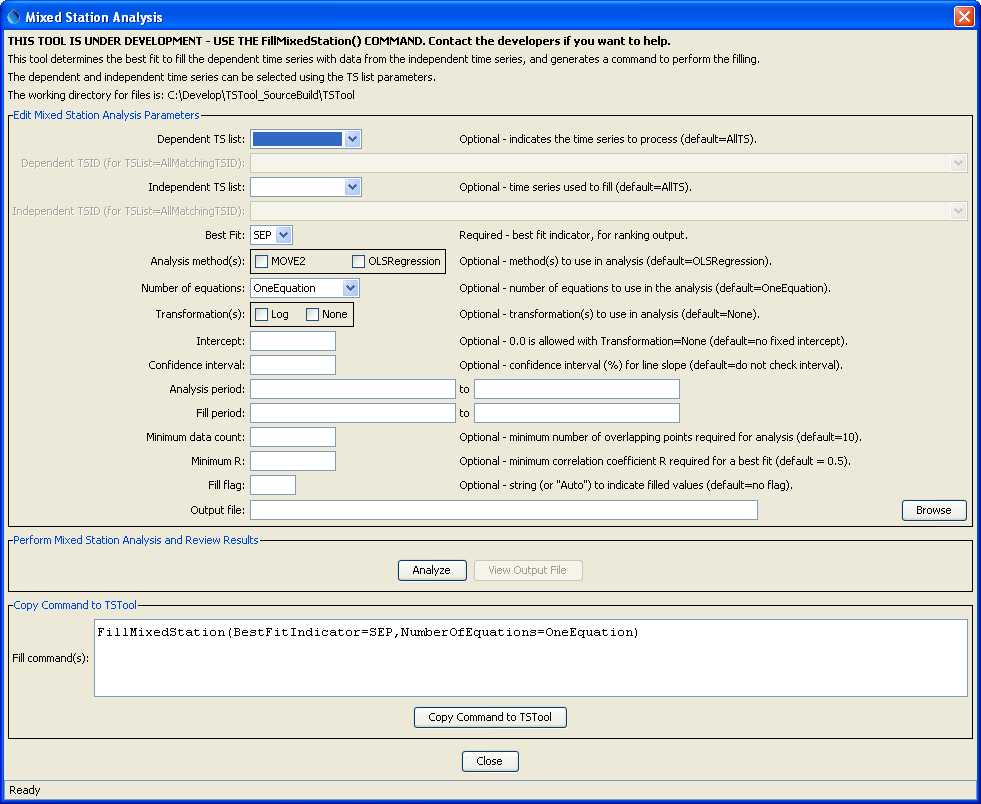
Mixed Station Analysis Interface (see also the full-size image)
Report Tools
Report tools analyze time series, typically creating a summary report.
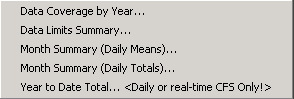
Tools / Report Menu
Data Coverage by Year Report
The Tools / Report - Data Coverage by Year menu processes the time series that have been selected and produces a report similar to the following (abbreviated). This report is useful, in particular, for evaluating data availability for multiple time series over a period. Although effort has been taken to make the report as compact as possible, it may need to be printed in landscape format on a large paper size.
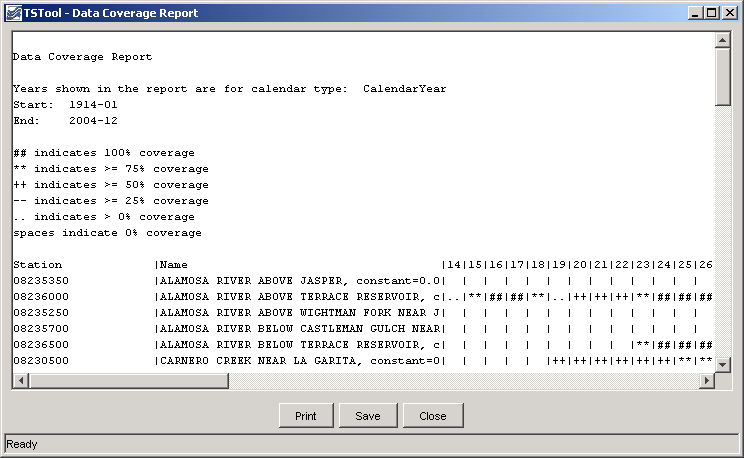
Data Coverage by Year Report (see also the full-size image)
Data Limits Summary Report
The Tools / Report - Data Limits Summary menu processes the time series that
have been selected and produces a report similar to the following (abbreviated).
The data limits summary for each time series is included.
This report is useful, in particular, for evaluating data availability for specific time series.
Currently, only monthly time series have detailed summaries.
All other data intervals shown overall period summaries.
The value -999 is used to indicate missing data.
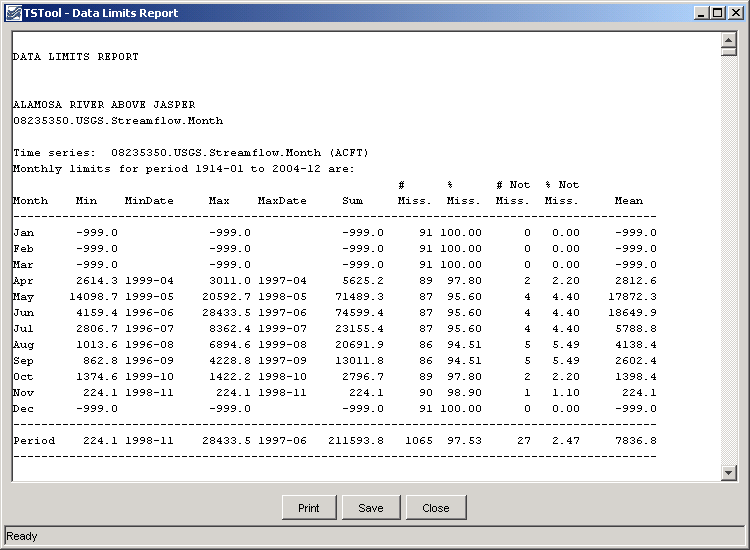
Data Limits Summary Report (see also the full-size image)
Month Summary Reports
The Tools / Report - Month Summary menus process the time series that have been selected and produces a report similar to the following (abbreviated). This report is similar to default summary output for monthly time series; however, it is applied to shorter data intervals, including minute, hour, and day interval. Values are first accumulated to daily values (by averaging the values in a day if the Daily Means report is chosen or by totaling the values in a day if the Daily Totals report is chosen). For example, use total for precipitation and means for average flows or daily temperature. The daily values are then further accumulated to produce monthly values, again using means or totals. The report includes a header for the time series, the report, and footnotes. Values are only shown if full data are available for a month and statistics are computed using only complete months.
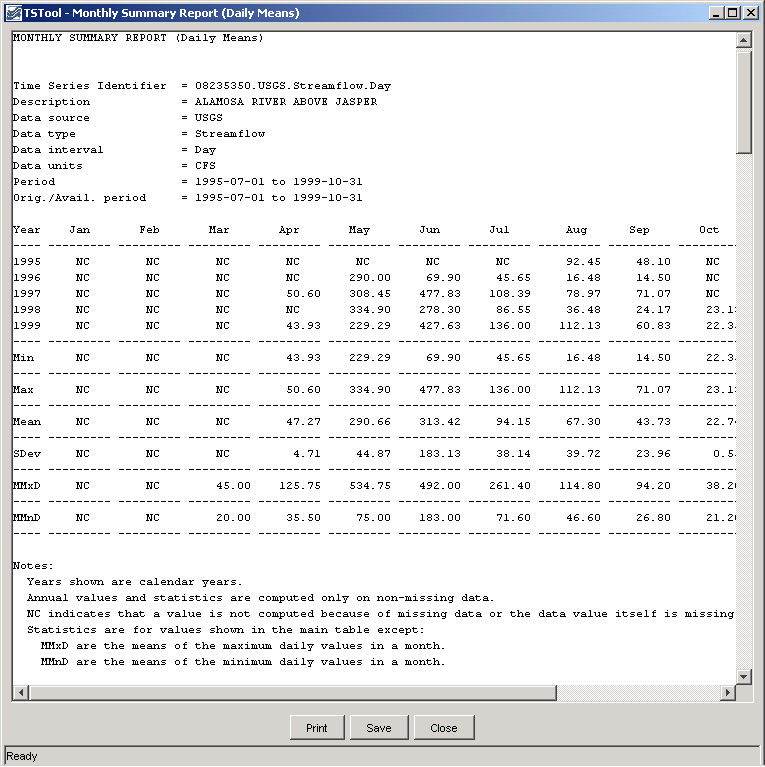
Monthly Summary (Daily Mean) Report (see also the full-size image)
Year to Date Total Report
The Tools / Report - Year to Date Total menu processes the time series that
have been selected and produces a report similar to the following (abbreviated).
This report is useful, in particular, for comparing on a volumetric basis the
different years of a time series over a full period.
The year-to-date volumes are sorted; to find a particular year, use the Search button on the report display.
The report information can then be used, for example, to select time series traces for analysis and output.
Currently, this report can only be used to process daily CFS data.
Real-time data can be analyzed by first converting to a daily interval using the
ChangeInterval command.
Warning: some years may have no data at the beginning of a year and the
corresponding year-to-date totals will consequently be zero.
Refer to the data coverage and data limit reports for more detail.
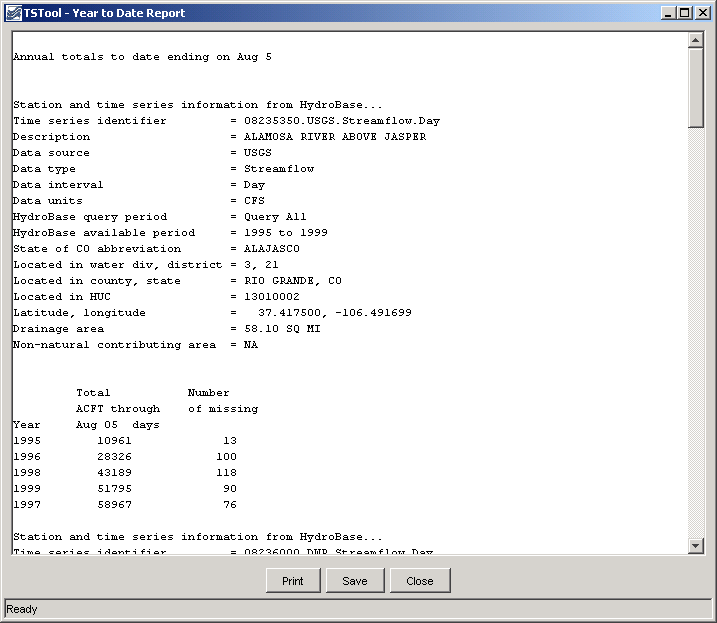
Year to Date Total Report (see also the full-size image)
Map Tools
The Tools / Select on Map menu button is enabled when a map is displayed (using View / Map) and time series are listed in the upper right part of the main window. The locations corresponding to selected time series or all time series in this list can be displayed on the map. See the Spatial Data Integration chapter for more information. Map features are implemented at only a basic level.
TSTool Options
The Tools / Options menu provides a way to set TSTool options during the session. Minimal capabilities are provided. Instead, the TSTool environment is typically configured in its configuration file (see the Installation and Configuration appendix), data store configuration files, and with commands.
Diagnostics
Diagnostics features are useful for troubleshooting. When an error occurs, a small warning dialog may be displayed, as shown in the following figure:
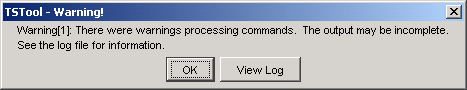
Example Warning Message Dialog
If results are not as expected, also review the messages in the status bar at the bottom of the main or secondary windows.
Diagnostics Settings
The Tools / Diagnostics menu item displays the Diagnostics dialog, which is used to set message levels and view messages as the application runs. The Diagnostics dialog (see the following figure) can be used to evaluate a problem.
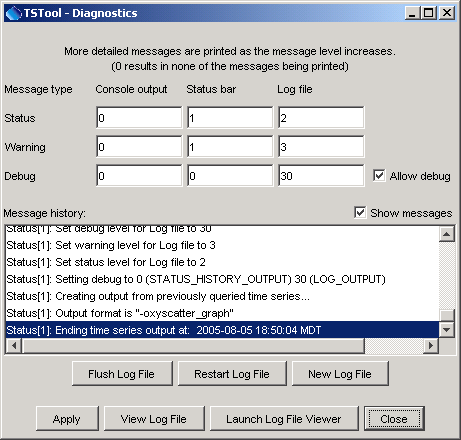
Diagnostics Interface (see also the full-size image)
The settings at the top of the dialog are used to specify the level of detail for messages printed to the console window, the status area at the bottom of the main window (and the Diagnostics dialog), and the log file. The log file contains warning, status, and debug messages, many of which are not normally displayed in the main interface. The log file is created in the logs directory under the installation directory. The Diagnostics interface features are as follows:
| Dialog Feature | Description |
|---|---|
| Status, Warning, Debug | Enter integer values, with larger numbers resulting in more output and slower performance. Zero indicates no output. If troubleshooting, a good guideline is to set the debug level to 10 or 30 (and select the Allow Debug checkbox). The default settings are often enough for normal troubleshooting and result in good software performance. |
| Allow Debug | Select to enable debug messages. Turning on debug messages will significantly slow down the software. |
| Show Messages | Select to display messages in the Diagnostics window. |
| Flush Log File | Force messages to be written to the log file. Messages can be buffered in memory and may not otherwise immediately be written to the log file. |
| Restart Log File | Restart the log file. This is useful if a long session has occurred and troubleshooting will occur on new actions. |
| New Log File | Open a new log file, with a new name. |
| Apply | Apply the settings in the Diagnostics dialog. |
| View Log File | View the log file in an integrated window. The View Log File button will be enabled if the log file has been opened. |
| Launch Log File Viewer | View the log file using a viewer from the operating system. On Windows computers, Notepad will be used. |
| Close | Apply the settings in the Diagnostics dialog and close the window. |
Diagnostics – View Log File
The Tools / Diagnostics – View Log File menu item displays the integrated log file viewer. Selecting this menu item is equivalent to selecting the View Log File button in the Diagnostics dialog. The log file viewer will be displayed in a window as shown in the following figure.
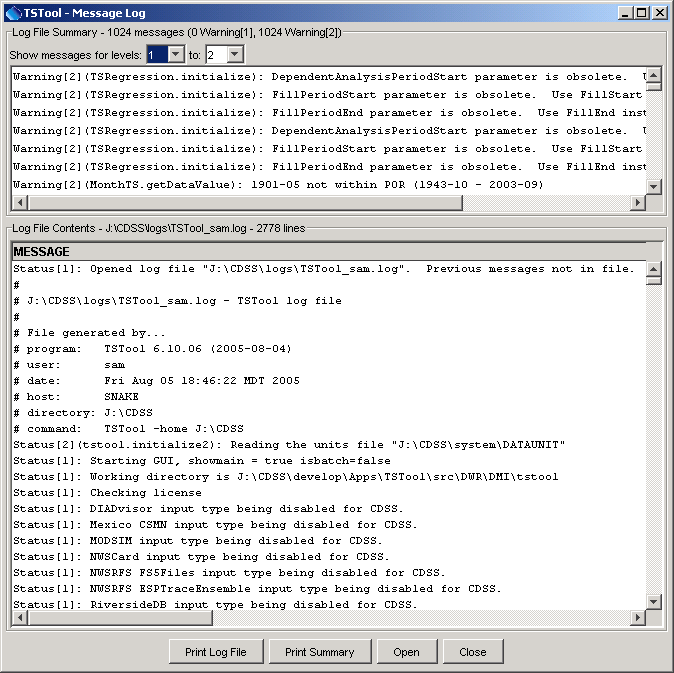
Log File Viewer Window (see also the full-size image)
The log file messages can be scrolled. To find a string in the log file, right-click and select the Find menu item. The information in the log file can also be copied and pasted into email, when contacting support.